DeepGauge

DeepGauge: Multi-Granularity Testing Criteria for Deep Learning Systems

DeepGauge defines a set of coverage criteria to evaluate the testing quality of Deep Neural Networks (DNNs) from multiple granularities. To demonstrate the usefulness of our proposed criteria, we performed a thorough evaluation on multiple representative datasets, DNNs on each of our coverage criteria with different experimental configurations. This website aims to accompany the paper to give more detailed discussion on the experimental configurations we have conducted.


This website is organized as follows: (1) we first present the evaluation results of DeepGauge on MNIST dataset, (2) followed by the evaluation of DeepGauge on ImageNet. (3)And finally, we present the evaluation of DeepExplores' neuron activation coverage on the same set of dataset and model, using the same configurations for comparison.


To make the experimental procedure as well as the configurations more accessible, we recapitulate the experimental settings on each section, although summarized evaluation discussion has already been given in the paper.

Overall, we select two popular publicly-available datasets, i.e., MNIST and ImageNet for evaluation. MNIST is for handwritten digit recognition, containing 70,000 input data in total, among which 60,000 are training data and 10,000 are test data. To further show the usefulness of our coverage criteria towards large real-world scaled DL systems, we also select ImageNet, a large set of general images for classification, containing over one million training data and 50,000 test data with 1,000 categories.


Part 1: DeepGauge's coverage critiera analysis results: MNIST

On MNIST dataset, we have studied three LeNet family models, including LeNet-1, LeNet-4, and LeNet-5) to analyze our criteria. Our proposed neuron-level coverage criteria needs to have the information (i.e., UpperBound, LowerBound) of each neuron. The whole DNN can be considered as the one that is programmed by training data that decides main functional region and corner-case region of each neuron. To obtain such information, we profile the DNNs runtime execution results (outputs) of each neuron using all the 60,000 training data of MNIST. For each DL model under analysis, we run the 10,000 test data on the model to obtain the different coverage cases. For each studied DL model, we also generate another four sets of adversarial test data, through three well-known adversarial techniques i.e., FGSM, BIM, JSMA, and CW.

After generating the three adversarial datasets, we aggregate each of them with the original MNIST test dataset (with a total size 20,000 for each), which enables us to perform the comparative study on the effectiveness of the existing MNIST test dataset and how adversarial test data enhances the defect detection ability, from our coverage criteria measurement.


Our paper shows a set of running configurations for evaluation. To be more thorough, this website gives all the experimental settings we have performed. For each criterion, we also evaluate the following parameters, in particular, we have in total 3(models) * 5 (datasets) * 14(criteria configurations) = 210 configurations The 5 datasets for each model are consisted of one original test data, and 4 adversarial generated data by FGSM, BIM, JSMA and cW (aggregated with original test data), respectively. It is worth noting that these adversarial data generation is often model dependent, the adversarial datasets are actually different for each model, although the number of datasets to evaluate on a model is 4. For example, for FGSM algorithm, we actually use it generate three adversarial datasets, one for each of LeNet-1, LeNet-4, and LeNet-5, respectively.
The detailed configurations for each criterion are shown as follows:

  • K-multisection neuron coverage (2 settings): k=(1) 1,000, (2) 10,000
  • Strong Neuron Activation Coverage (3 settings): UpperBound=(1) u, (2) u+ 0.5 * std, (3) u+ 1.0 * std, where u is the output upper bound (maximal value) obtained for each neuron during profiling training data; similarly, std is the standard deviation of all the output of a neuron during profiling. It shows that the outputs of different neruons follow quite different statistical distribution, resulting into different u and std values. The u and std give the fine-grained measurement for neuron coverage, and each neuron have its own specific u and std based on the profiling results.
  • Neuron Boundary Coverage (3 settings): (1) LowerBound=l, UpperBound=u, (2). LowerBound=l - 0.5 * std, UpperBound=u+ 0.5 * std, (3). LowerBound=l - 1.0 * std, UpperBound=u+ 1.0 * std, where u and std represent the same meaning as in Strong Neuron Activation Coverage, l is the lower bound (i.e., minimal values) during profiling for each neuron.
  • Top-k Dominant Neuron Coverage(3 settings): k=(1) 1, (2) 2, (3) 3
  • Top-k Dominant Patterns(3 settings): k=(1) 1, (2) 2, (3) 3


  • We give the detailed discussion and explanation on the MNIST resulting data, and highlight the difference for results obtained on ImageNet. For simplicity, all Figures in section 1 (MINIST) would be considered as Figure 1 set with subfigure (a), (b), (c), etc.; similarly, all Figures in section 2 (ImageNet) would be the Figure 2 set.

    Coverage result plot for each critera and configurations:

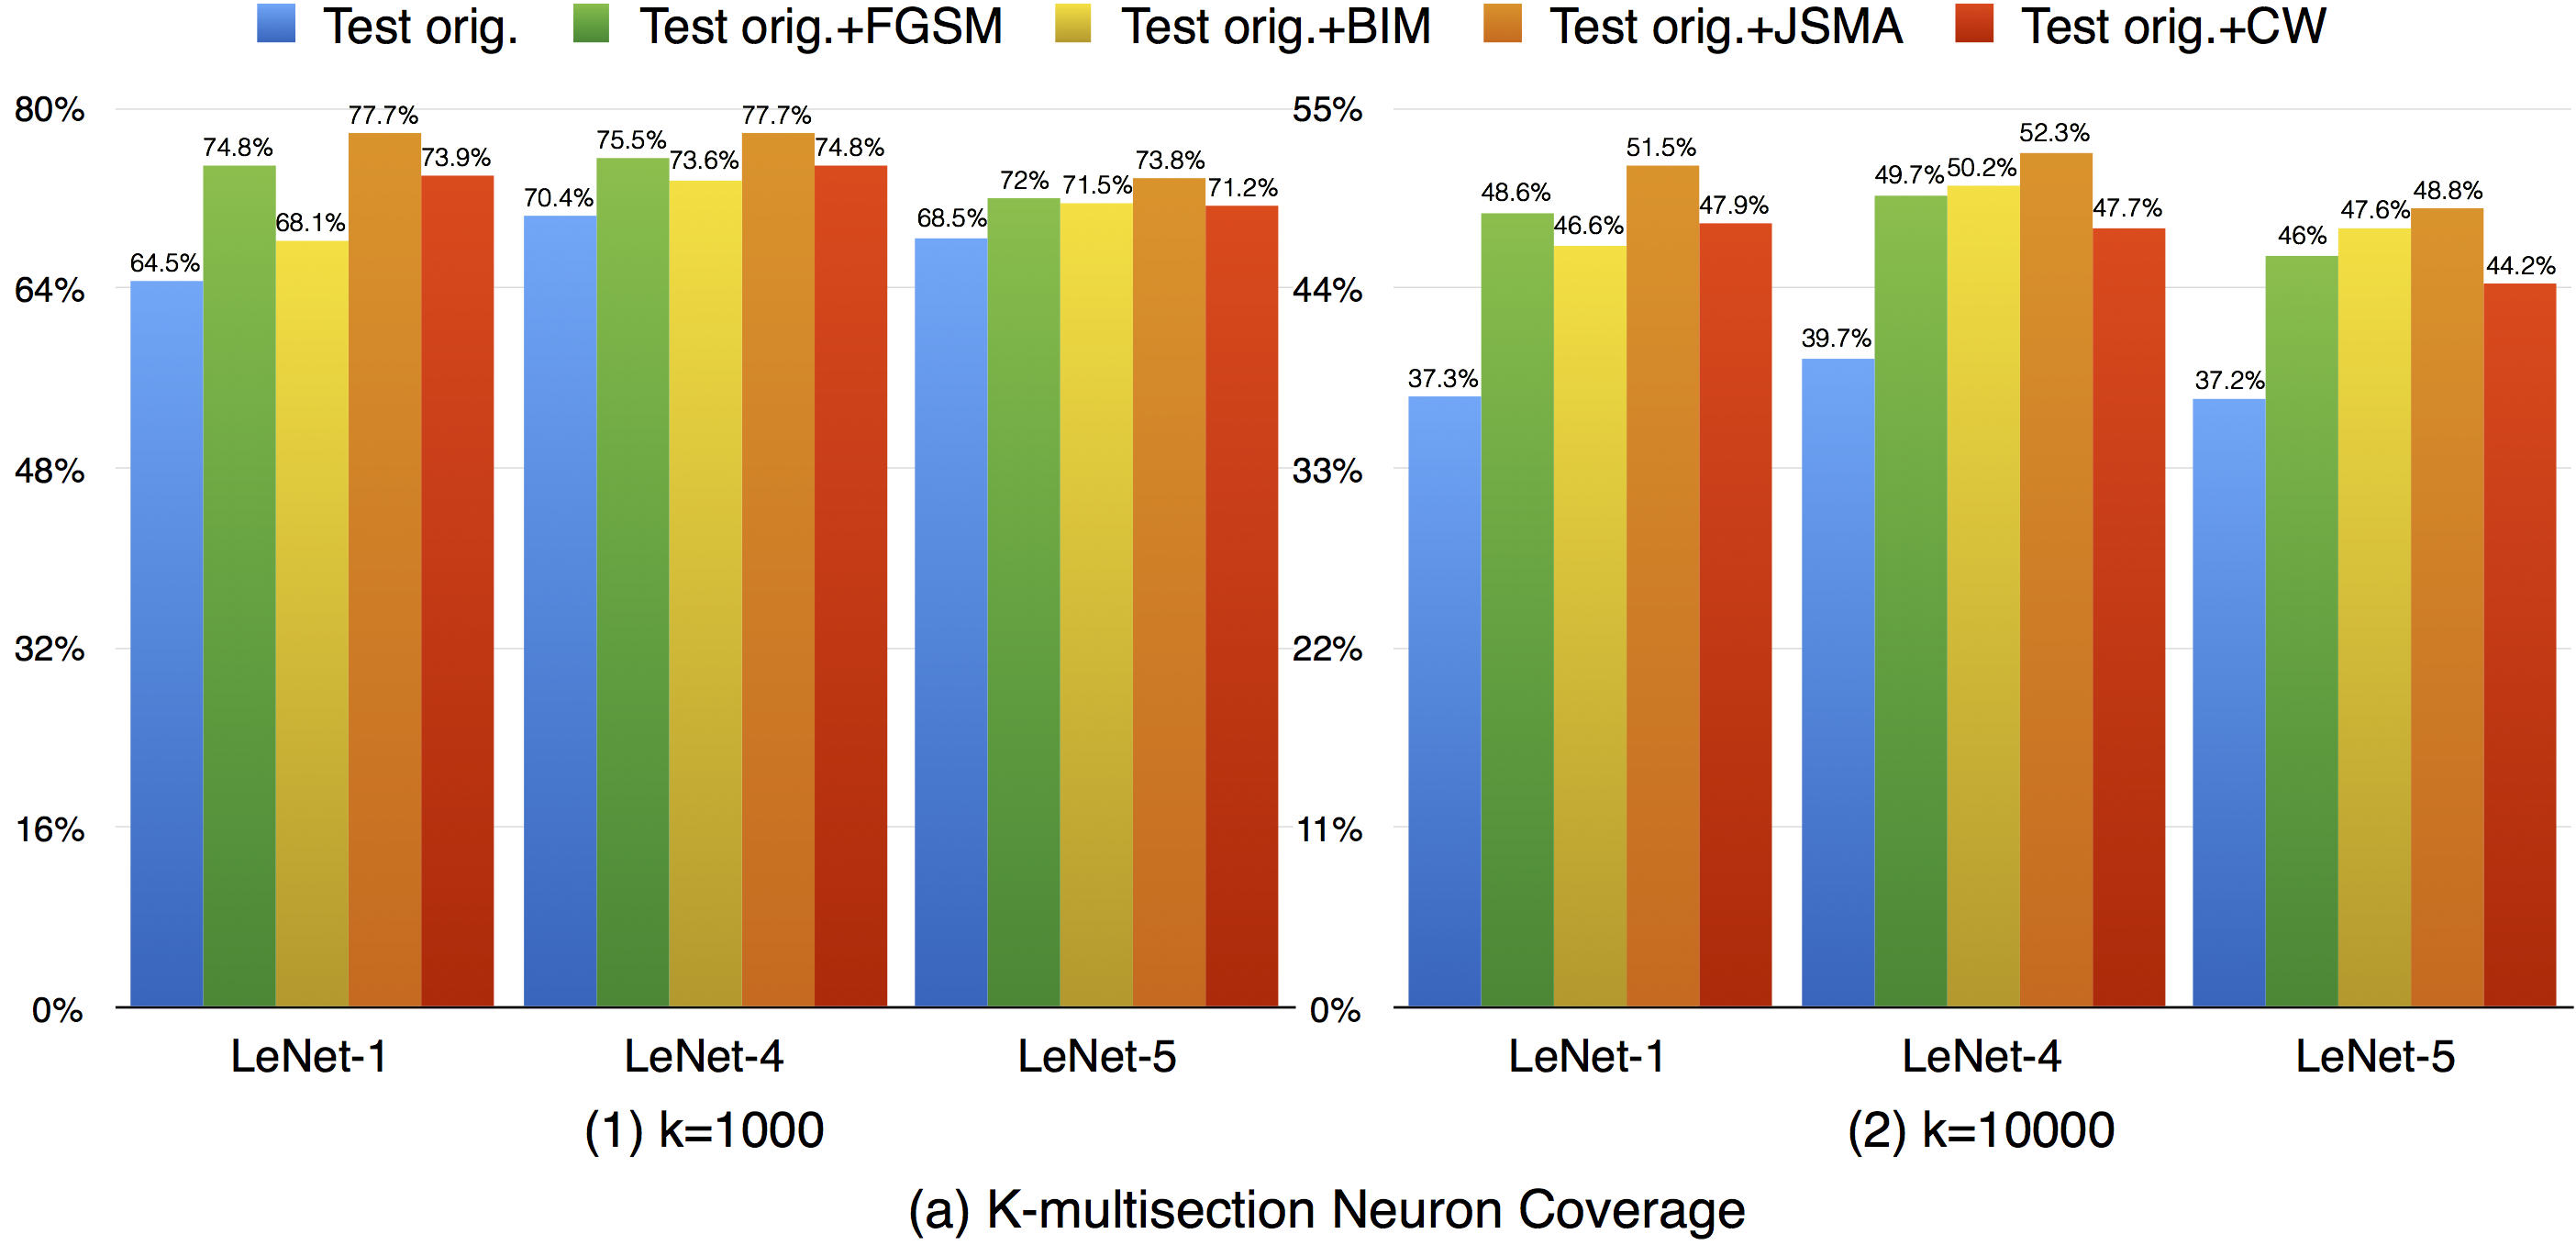
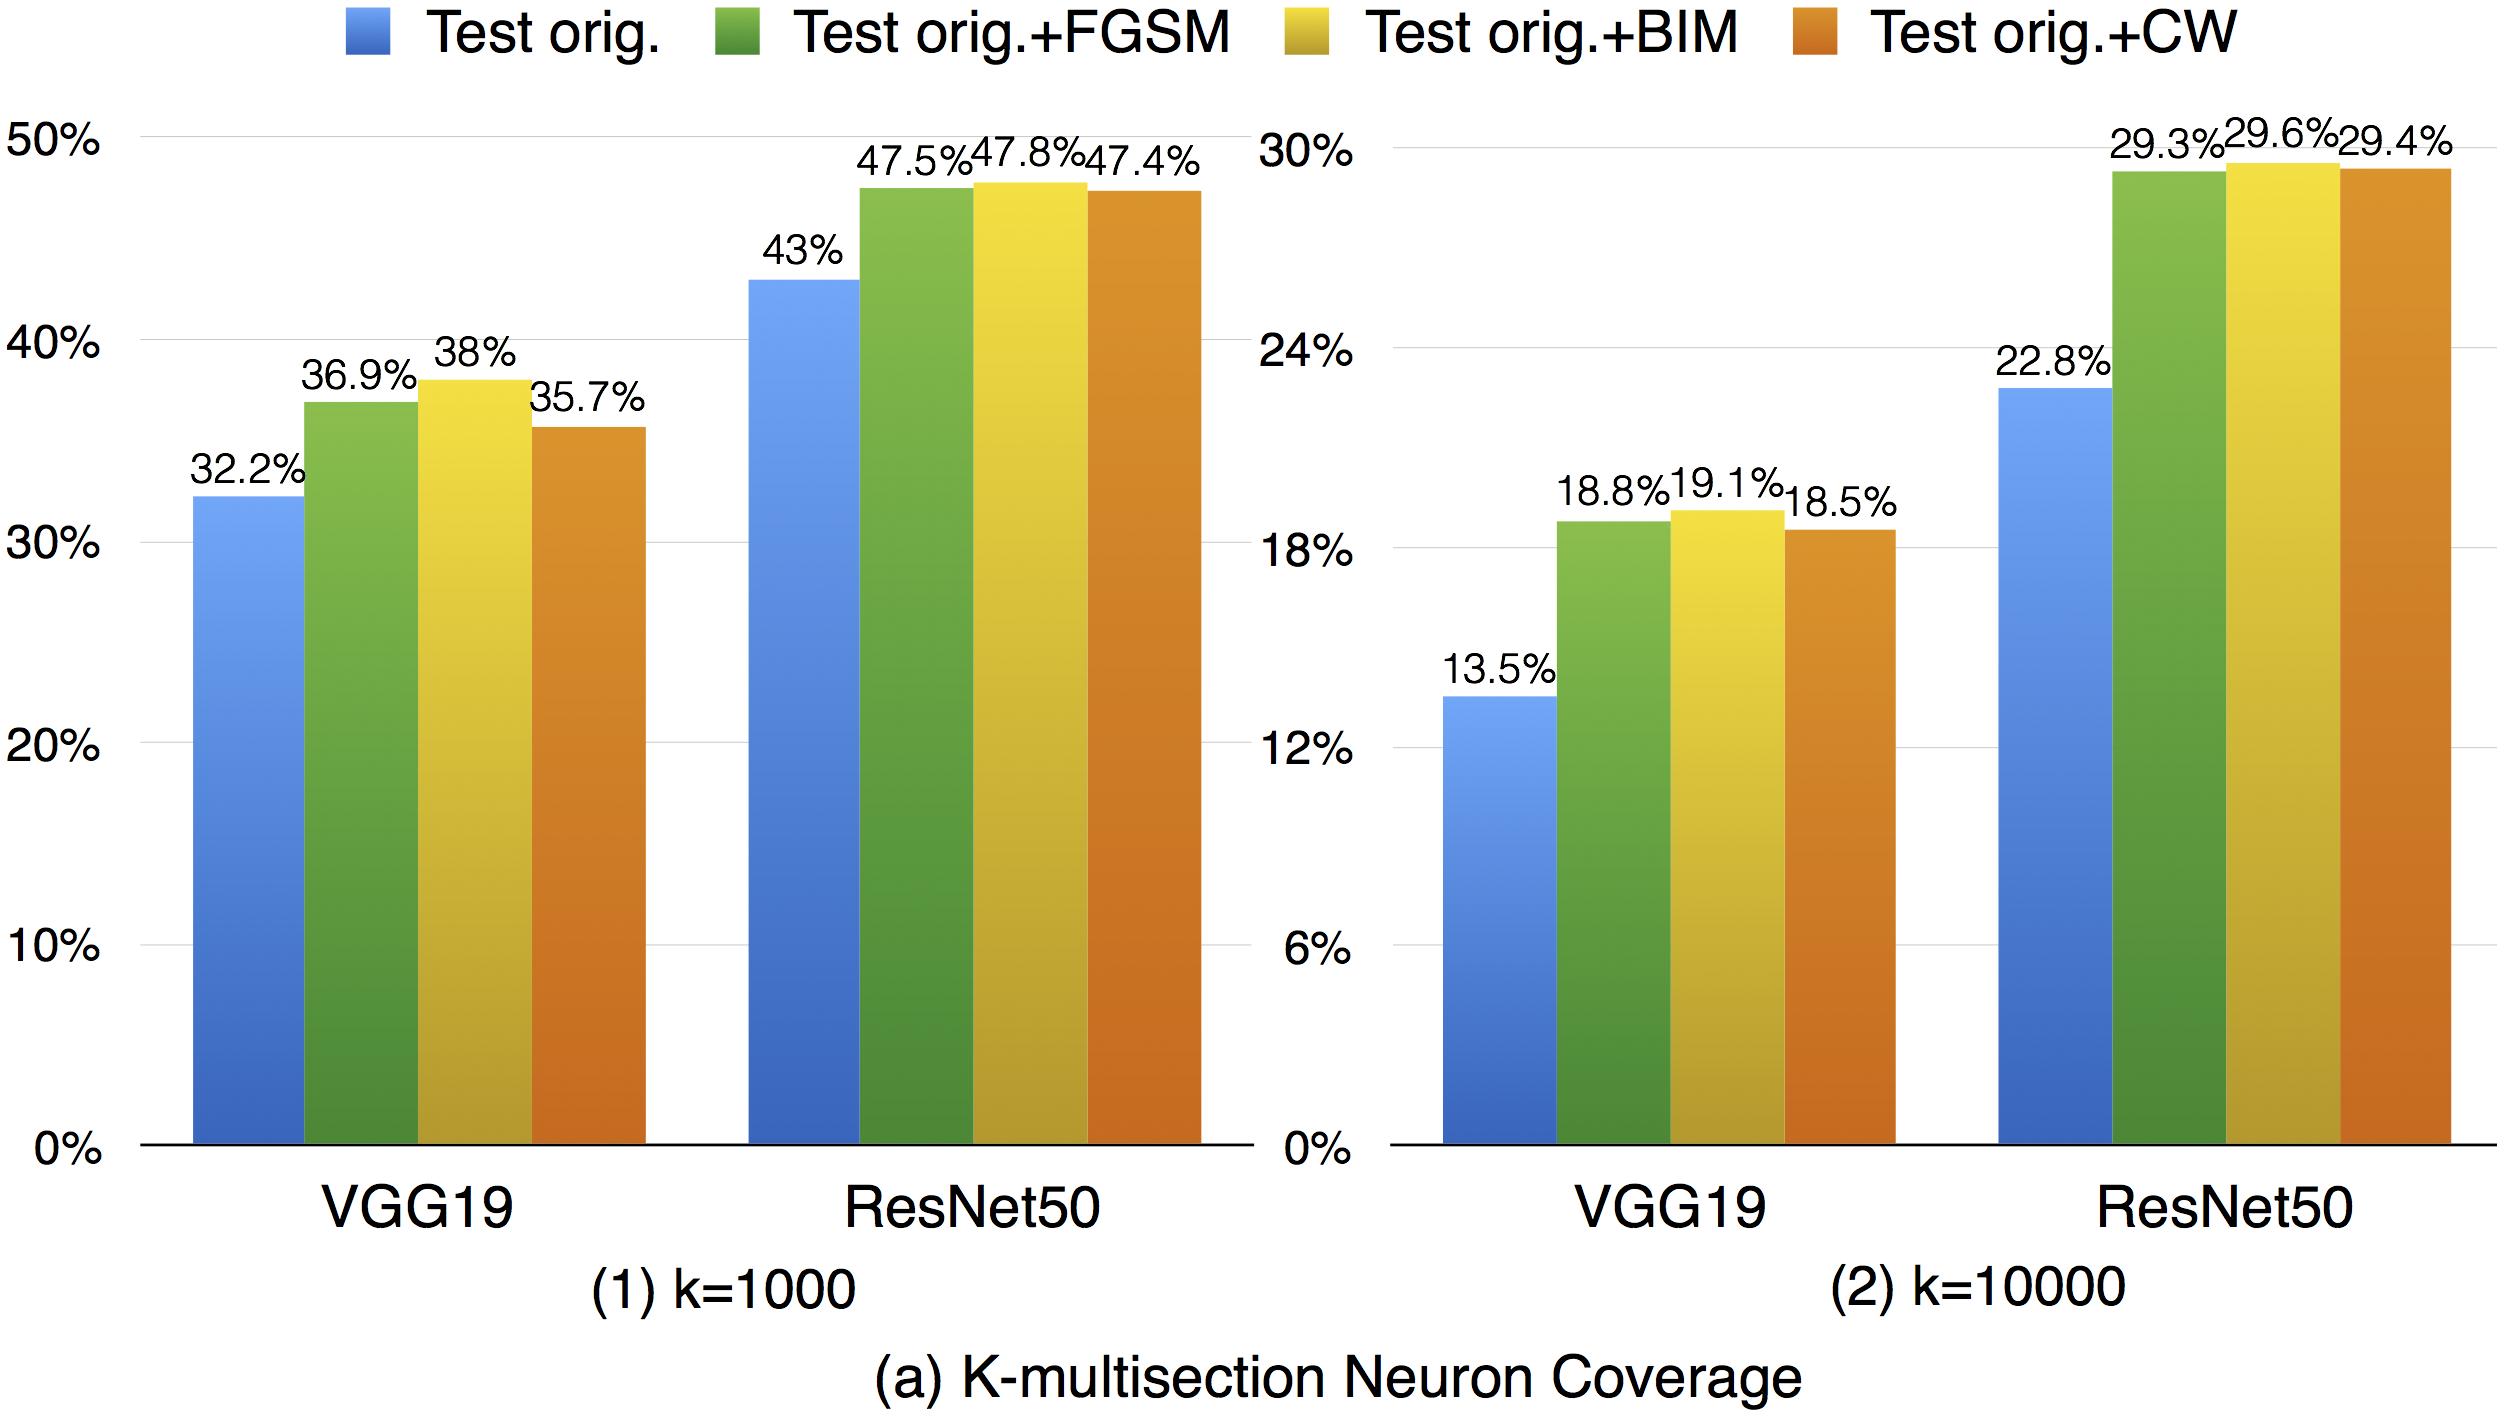
    For k-multisection neuron coverage, we performed on two settings, where k=1,000, and k=10,000, which are reasonable choice considering the test dataset size. On these two settings, we find that the adversarial test data could cover different main functional region compared with original test data, which could be observed in both settings, where the coverage improvement for k=10,000 setting is more obvious compared with k=1,000 due to is finer granularity. This means that increasing the k-multisection neuron coverage could potentially detect more defects of a DNN. On the all evaluated MNIST configurations, we find that JSMA shows slightly better performance to obtain higher k-multi-section coverage compared with other FGSM and BIM. Although these adversarial techniques improve this coverage compared with original test data, there are still many main functionality that are missed by the adversarial data.

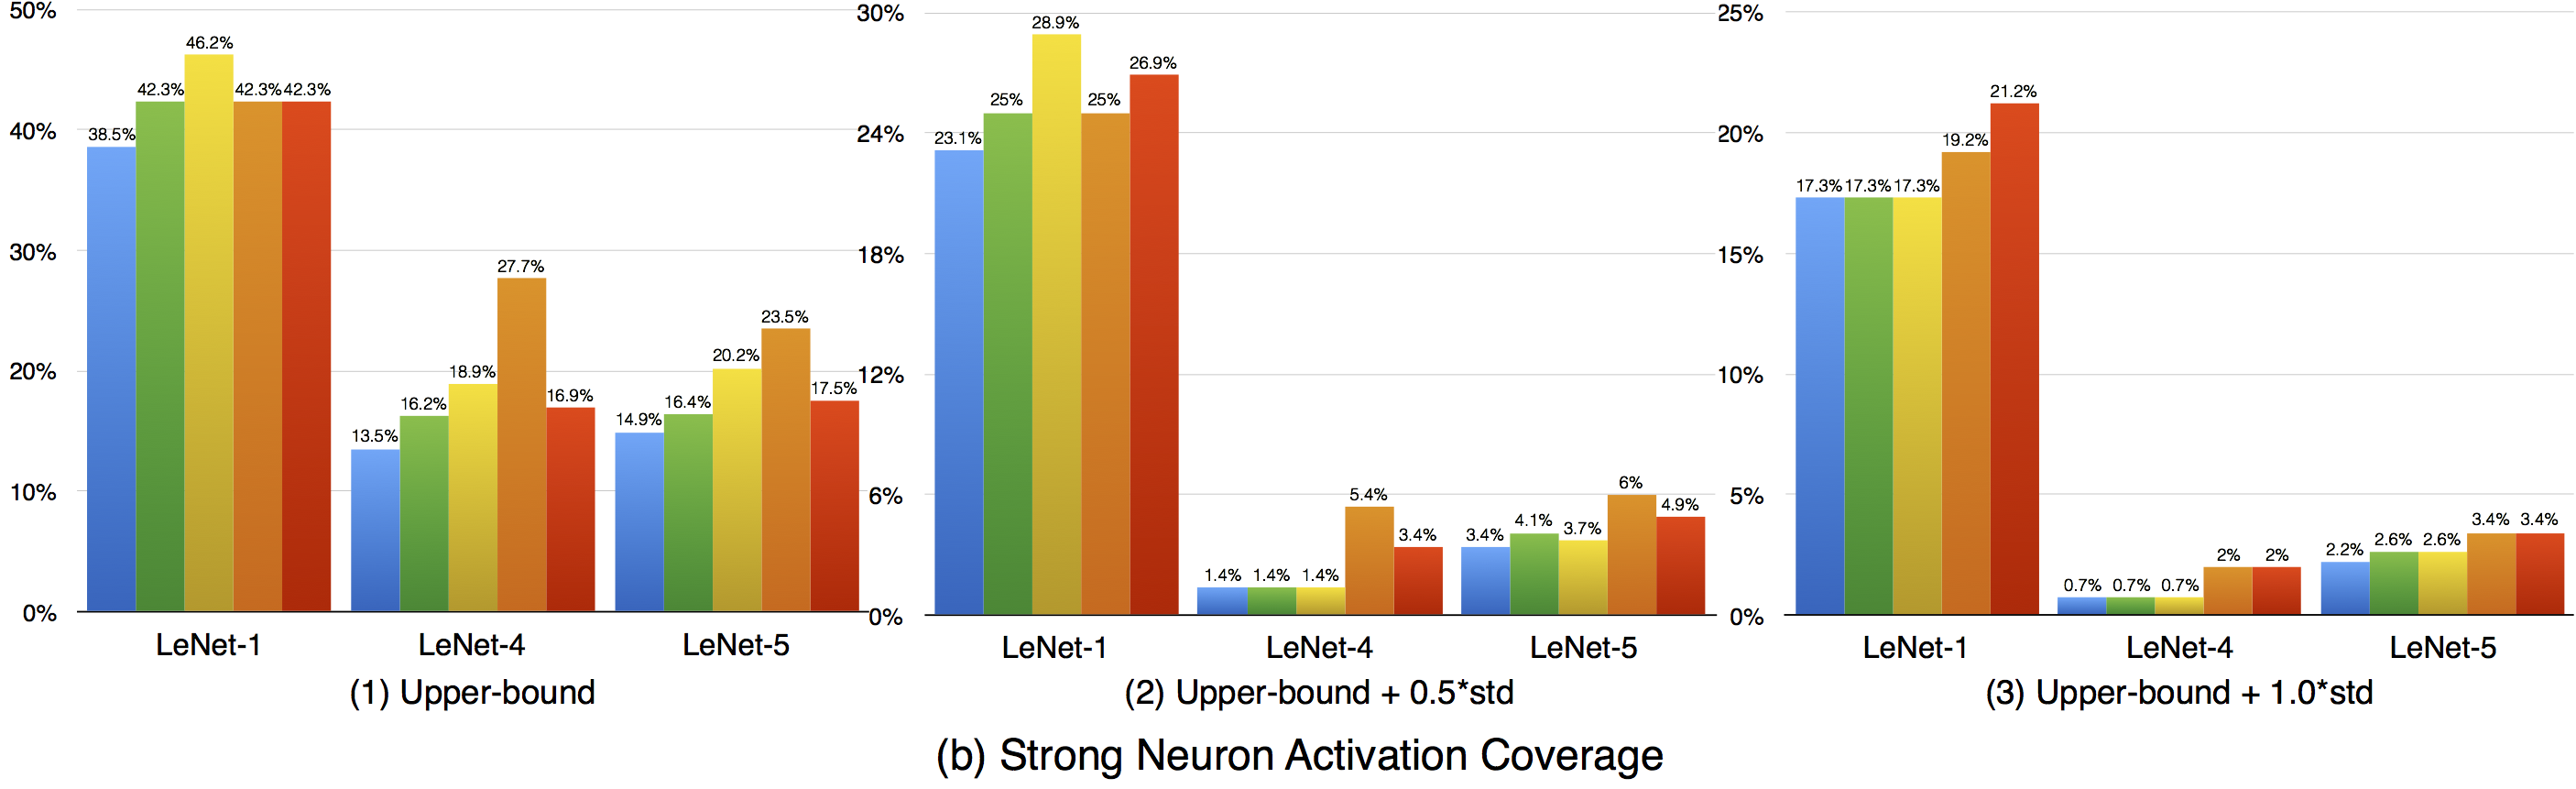
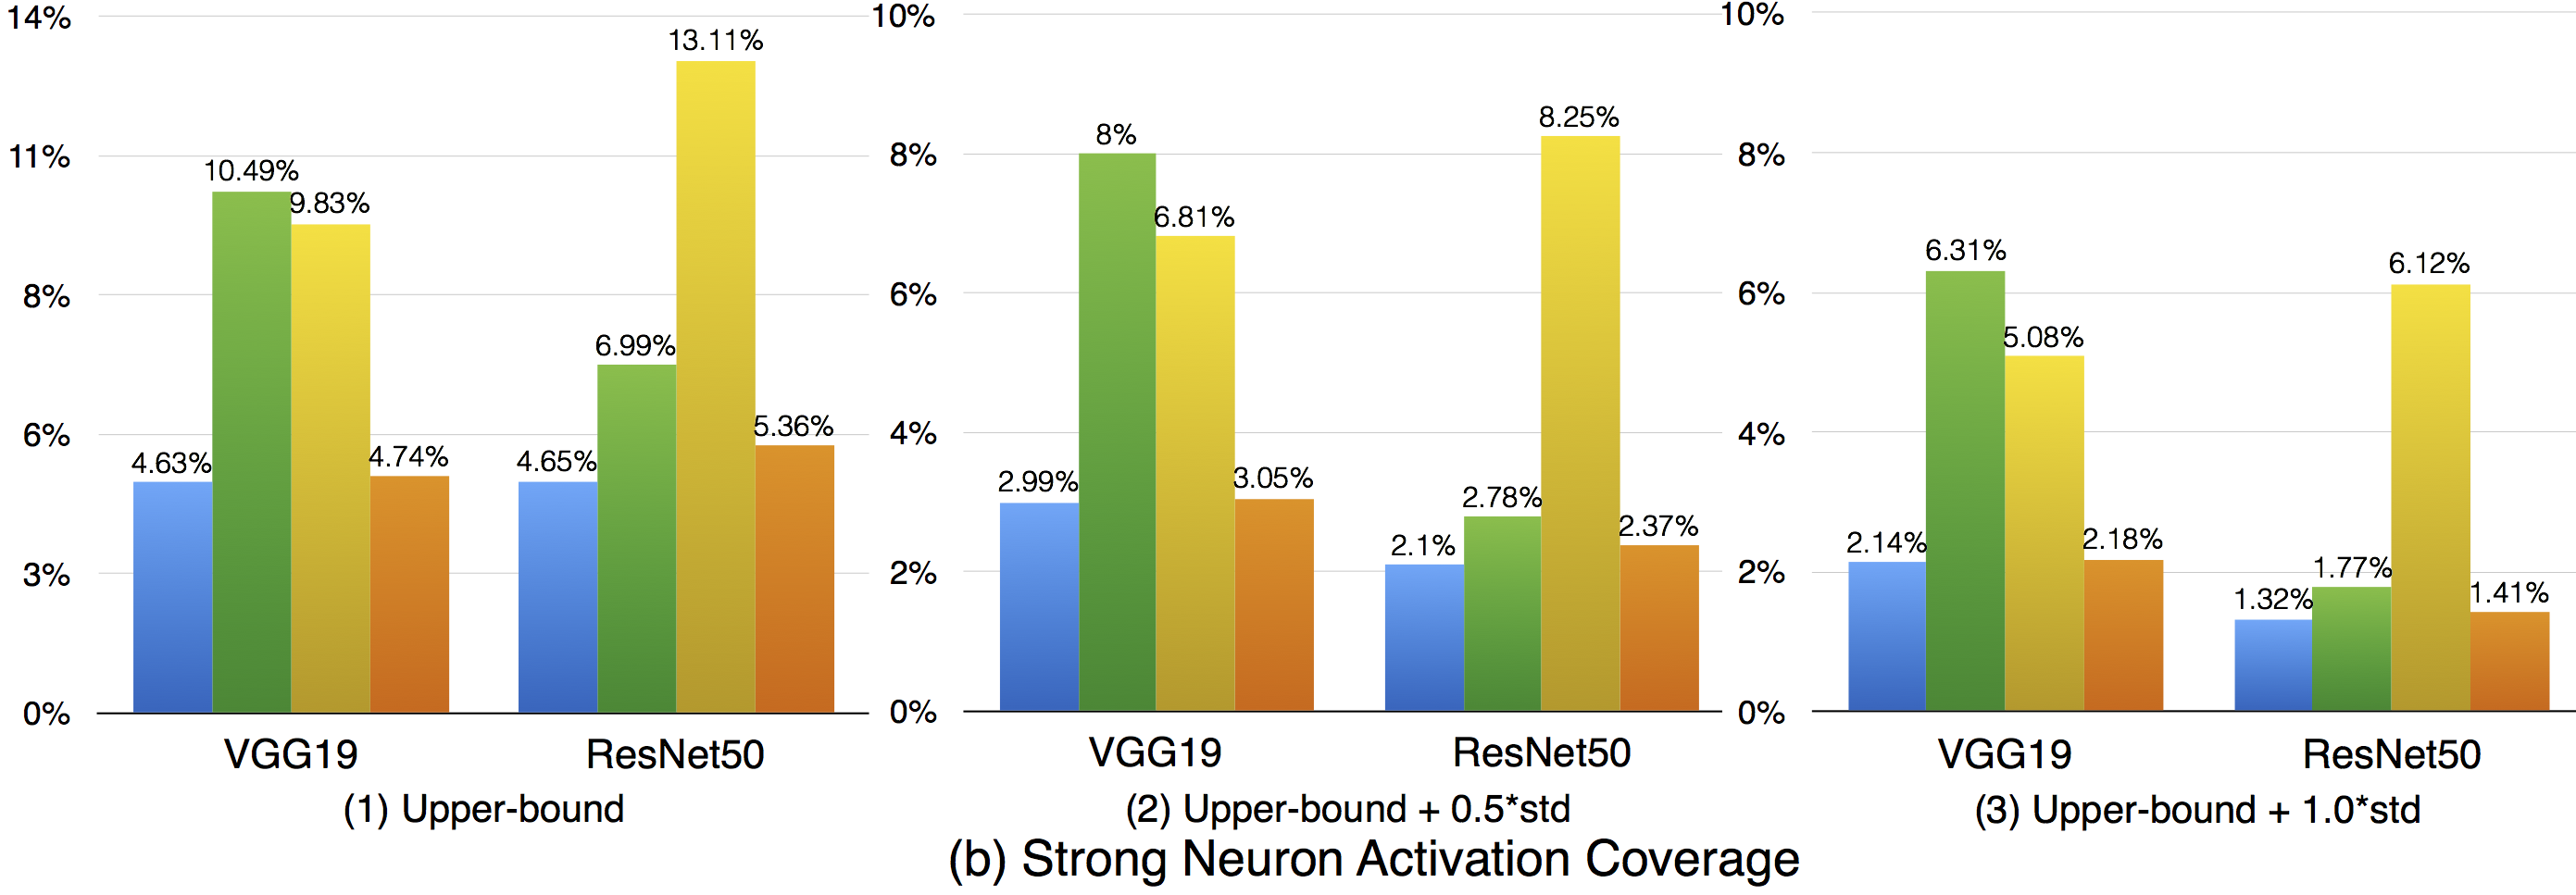
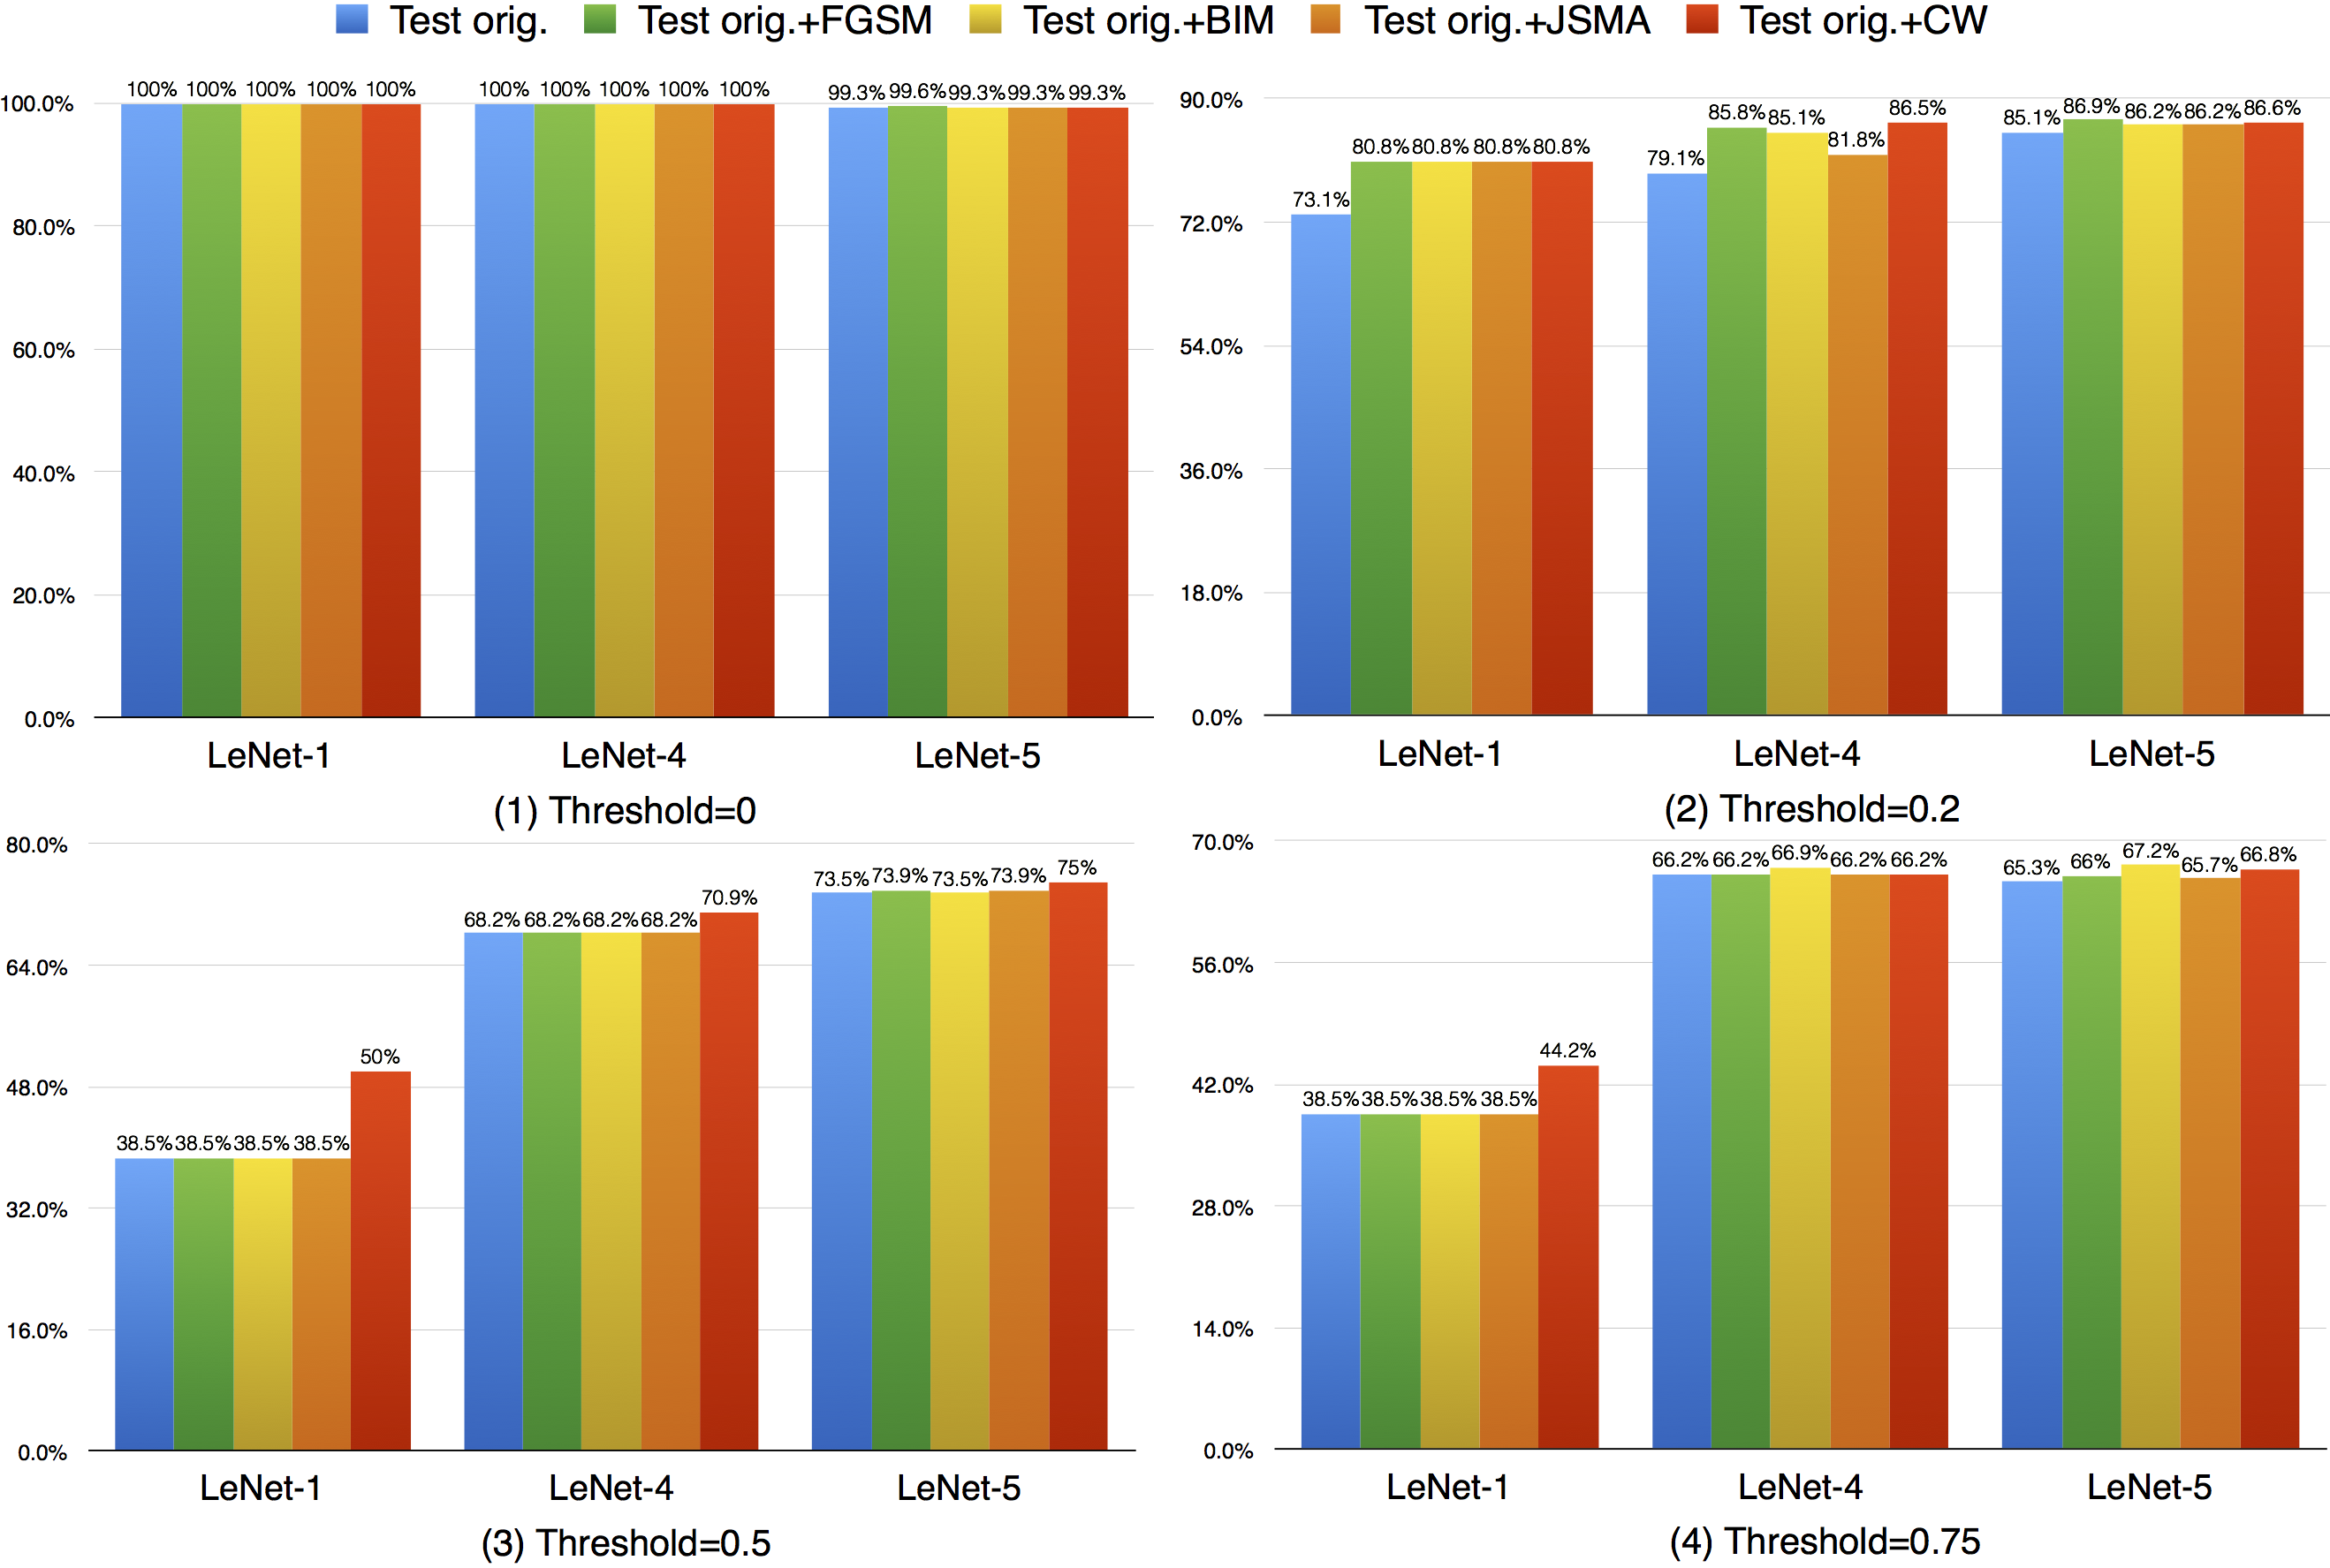
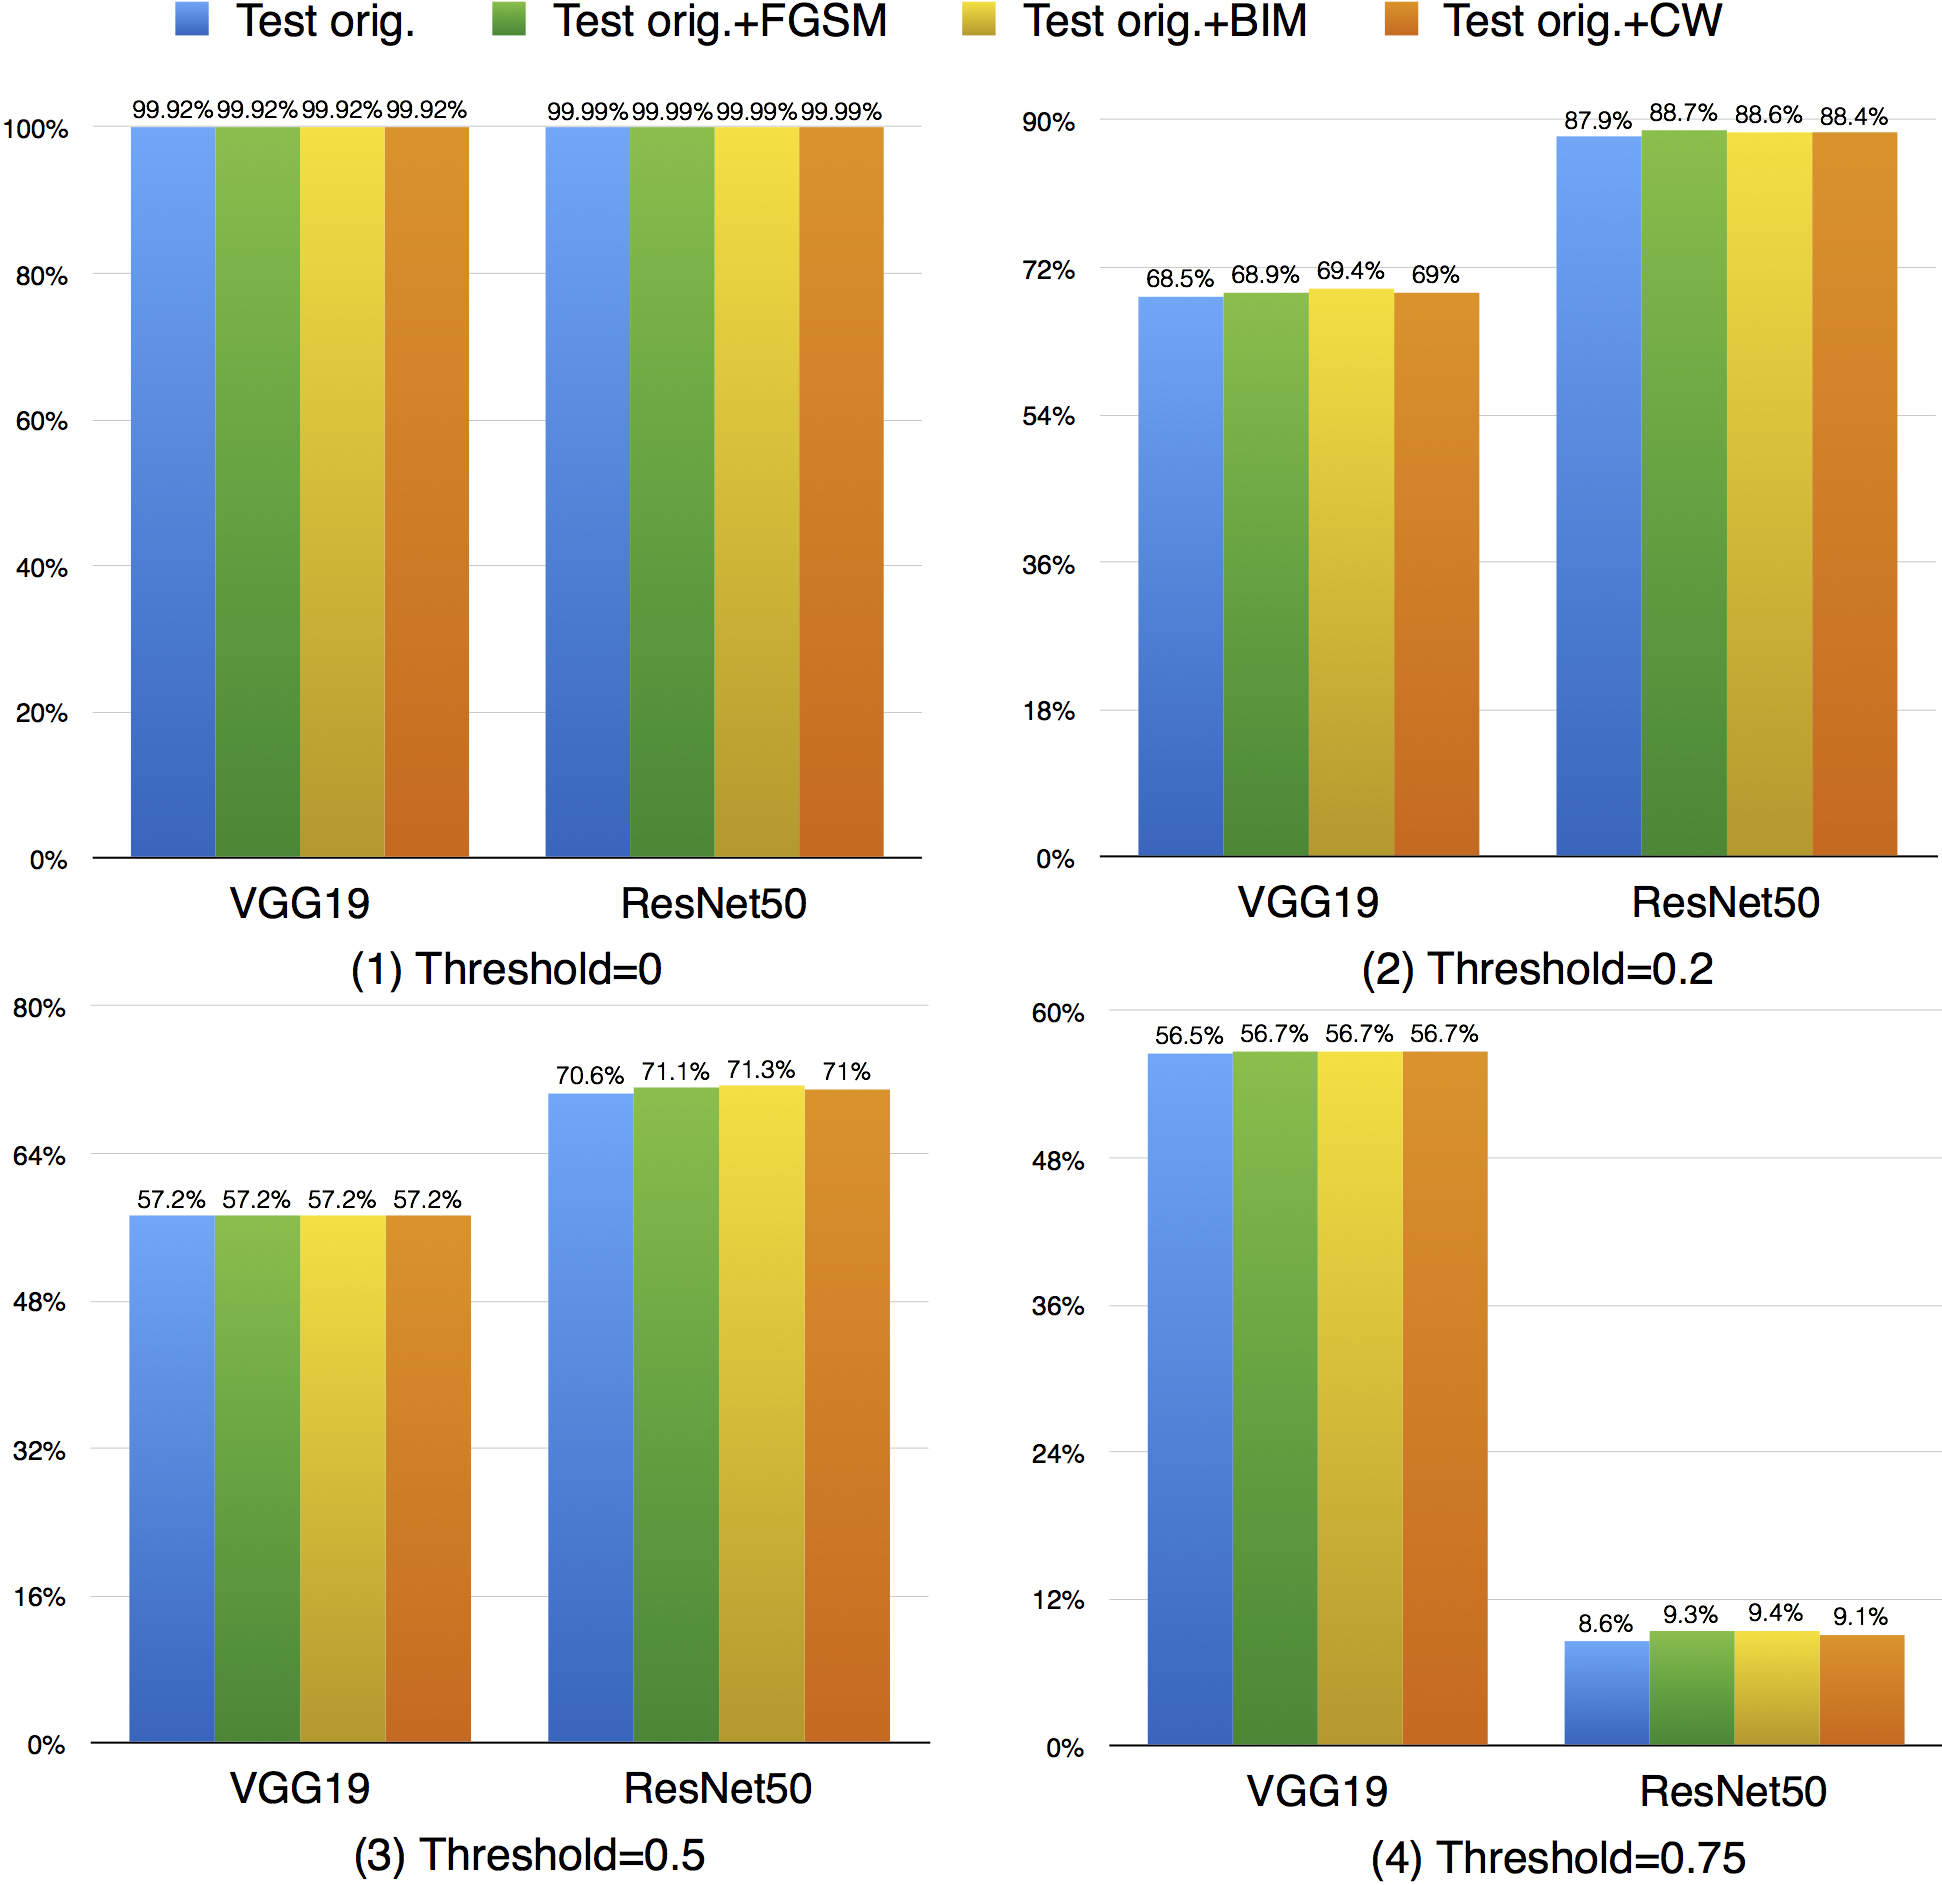
    Compared with k-multisection neuron coverage, strong neuron activation coverage achieved for original test data is generally lower on each evaluated configuration, indicating that original test data focuses more on testing the main functionality of DNNs. Note that, we use three UpperBound settings, the larger its value, the higher deviation (more rare cases) from the main functional region. The resulting data is consistent with these 3 settings, the larger Upperbound is given (e.g., UpperBound+std), it is more difficult to cover the target region, resulting in lower coverage. Although adversarial data could greatly improve the strong neuron activation coverage (e.g., for LeNet-4, JSMA improves the coverage by 105%, from 0.135 to 0.277 for configuration 1; by 286%, from 0.014 to 0.054 for configuration 2; and by 186%, from 0.007 to 0.02, for configuration 3), the total coverage obtained is still low, and it is still necessary to design other test data generation techniques that could effectively cover more on these missed regions.

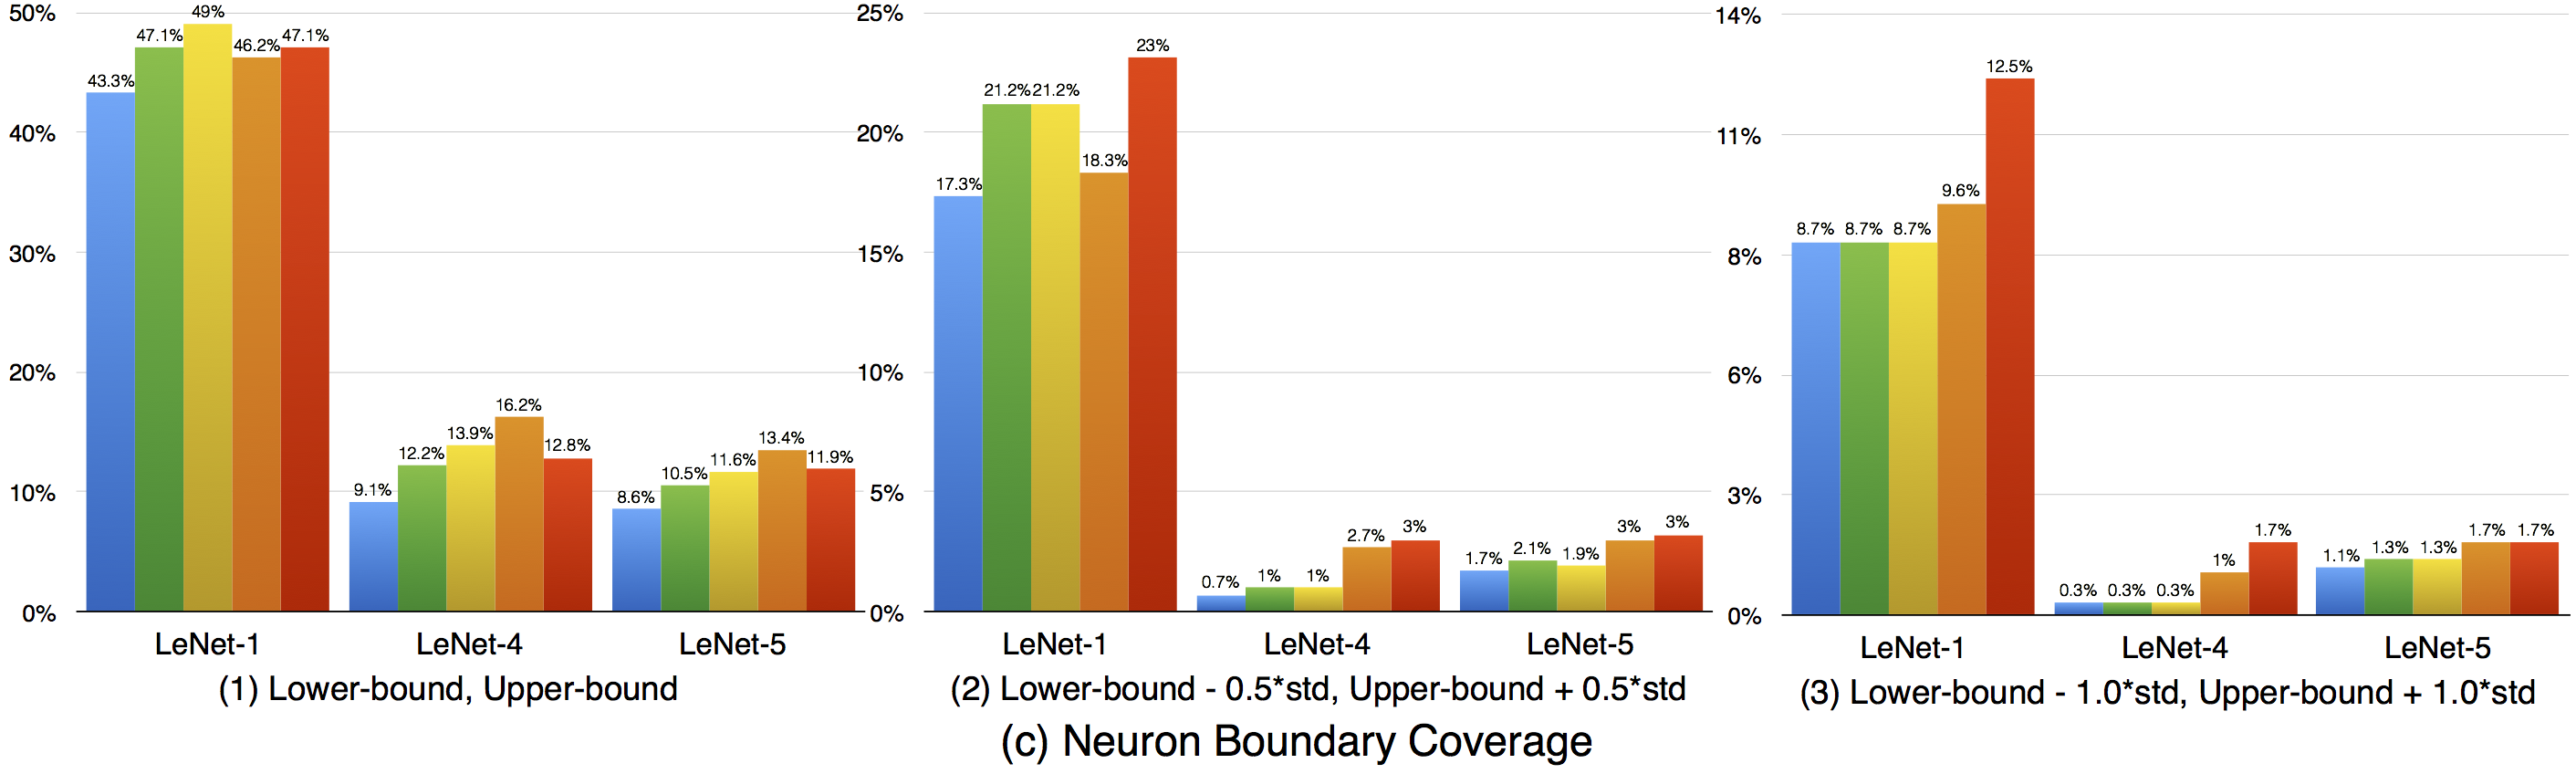
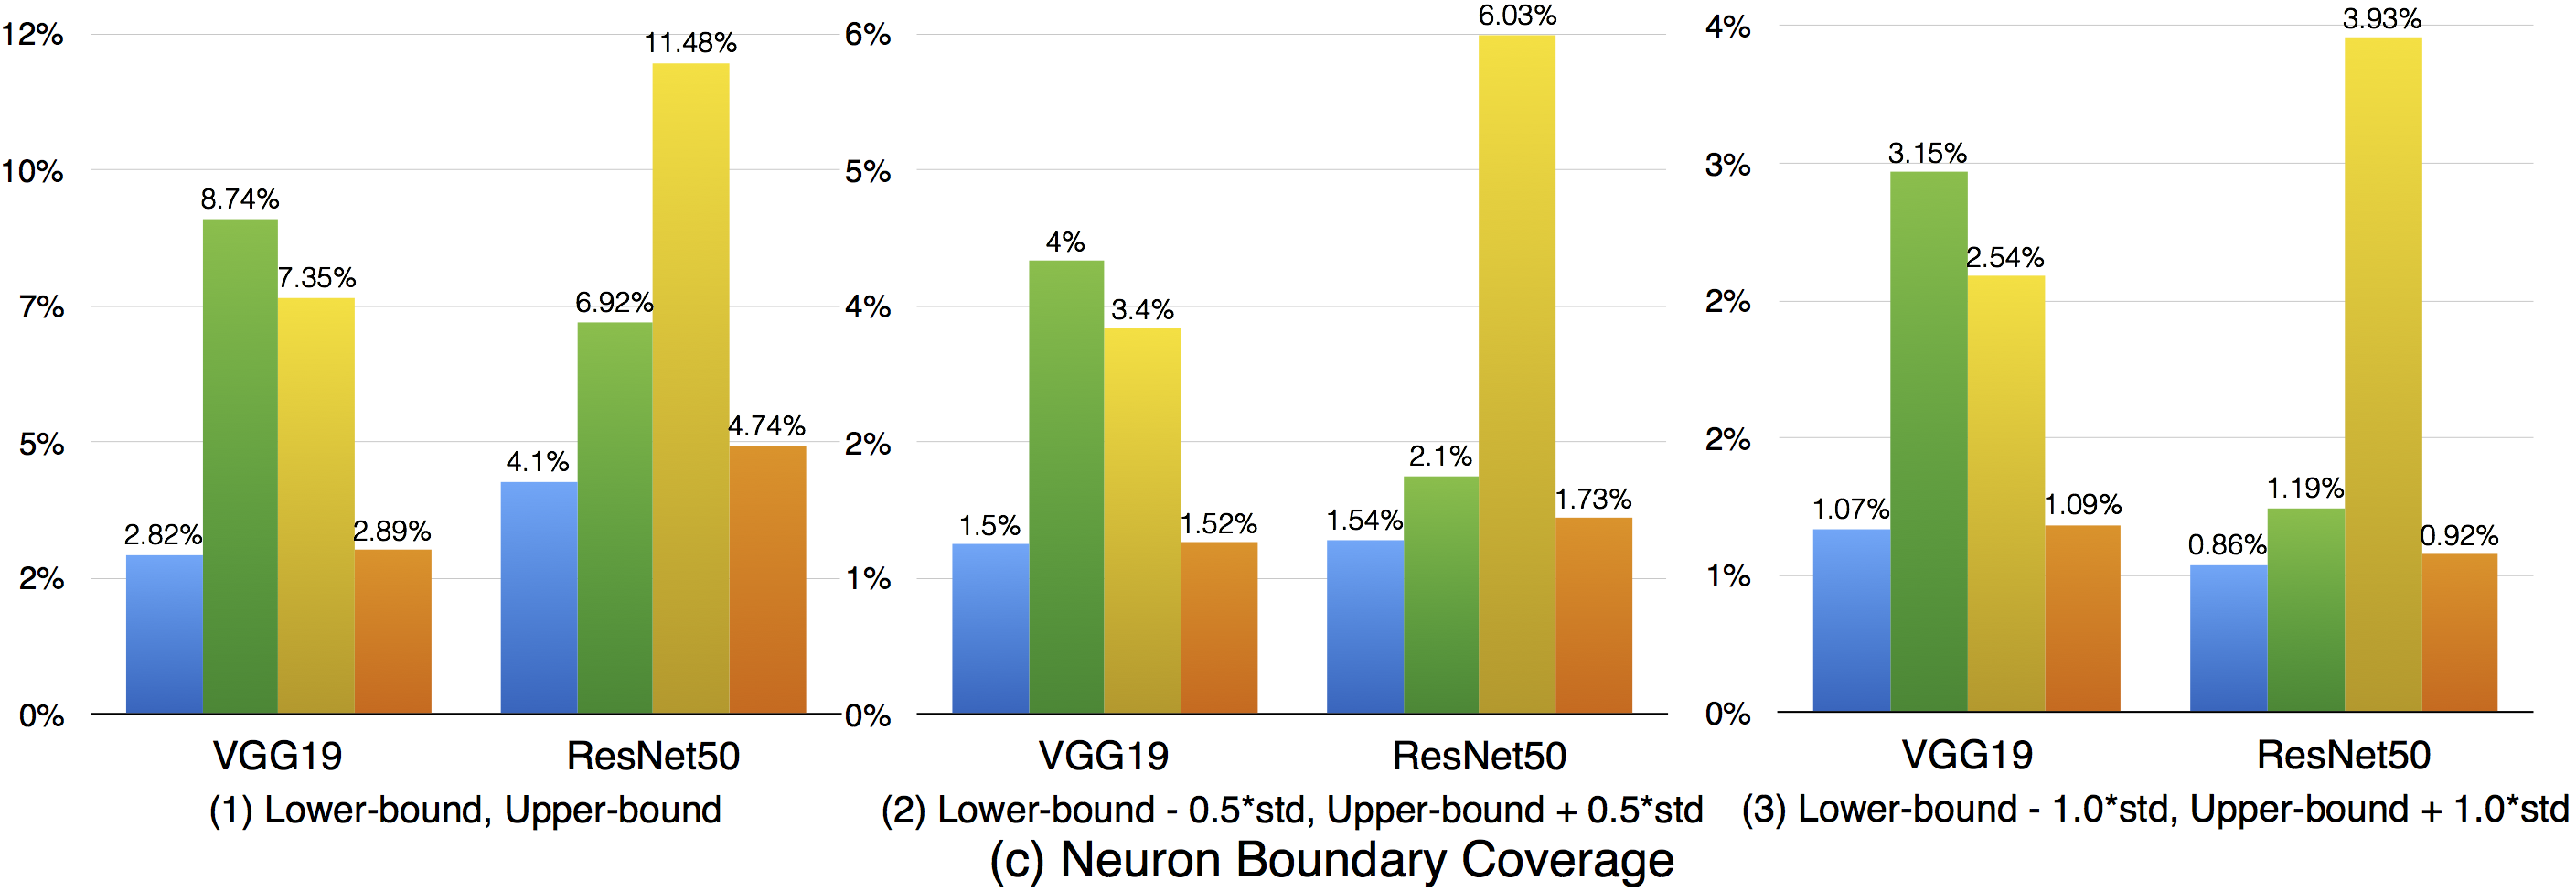
    Compared with strong neuron activation coverage that focuses on the neuron strong activation boundary case, the neuron boundary coverage also takes the non-activated boundary cases into consideration. Our empirical observation shows that the neuron non-activation cases also play an important role in final decision calculation (e.g., classification, prediction). In line with the strong neuron activation coverage on each corresponding configuration, we can see that neuron boundary coverage are often lower in most cases (LeNet-1 is an exception, which might be caused by its small neural network size), indicating that the covering the non-activated boundary on studied DNN could be even harder than covering the strong neuron activation case. This might be caused by the intrinsicality of the activation function used in the DNN, where ReLu would block the all negative cases and set output to zero. Since the adversarial generated test data would trigger the defects of DNN, it means that defects of DNNs could also exist in the corner-case regions, and further adversarial test data generation technique design should take this into account, which is missed by current techniques.

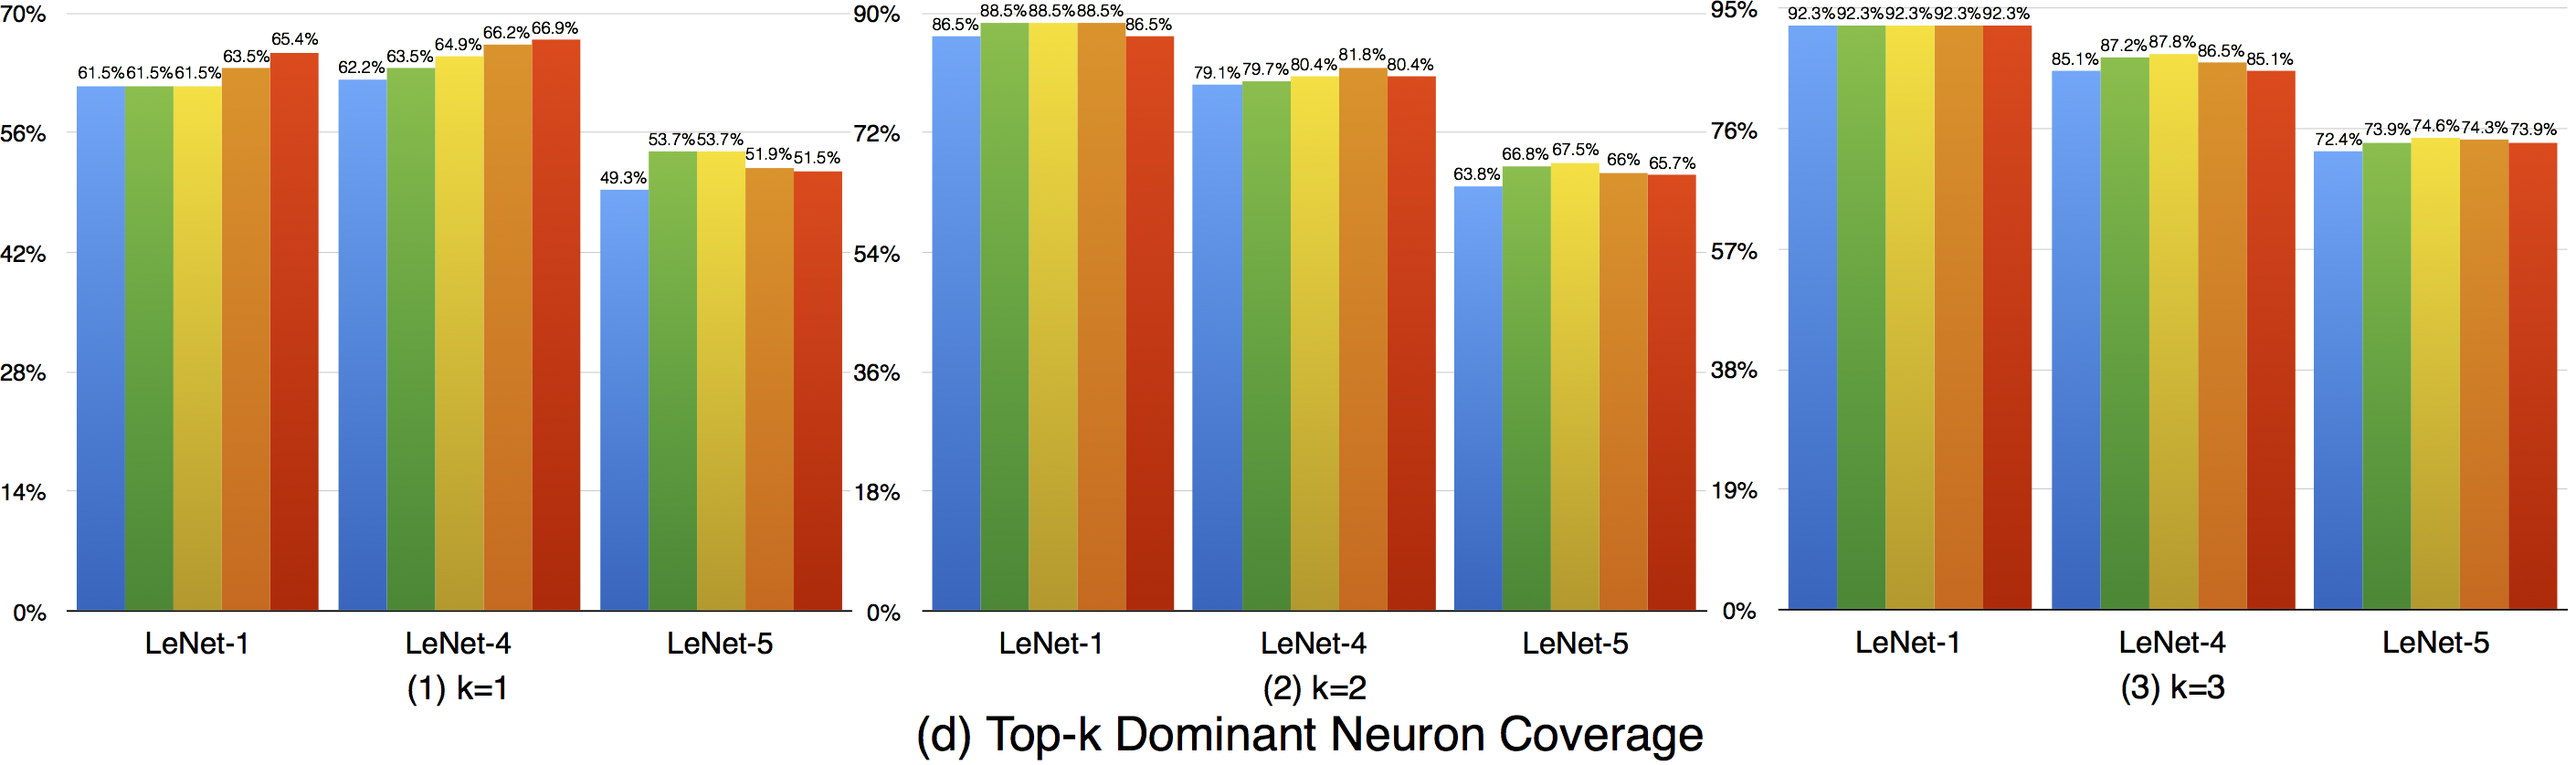
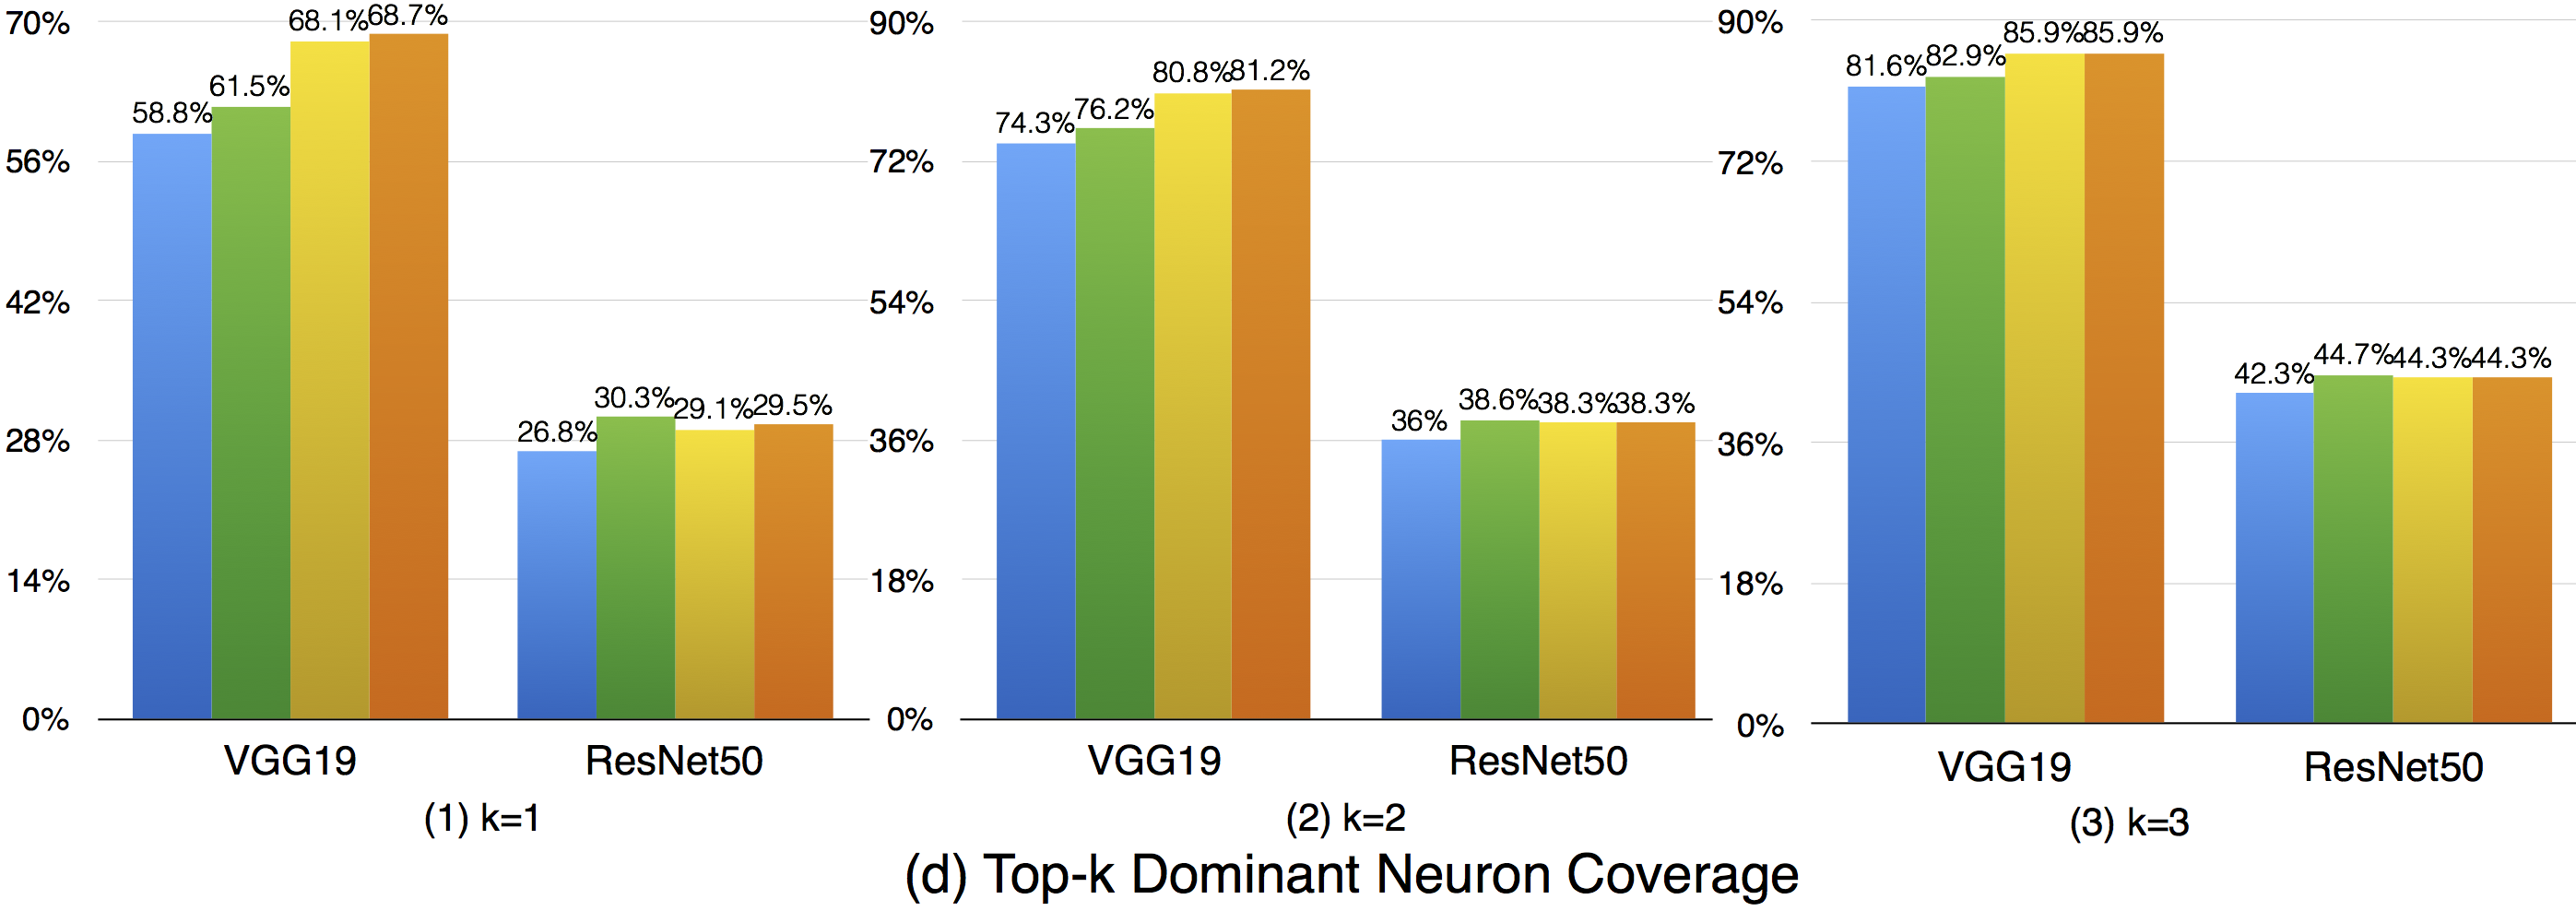
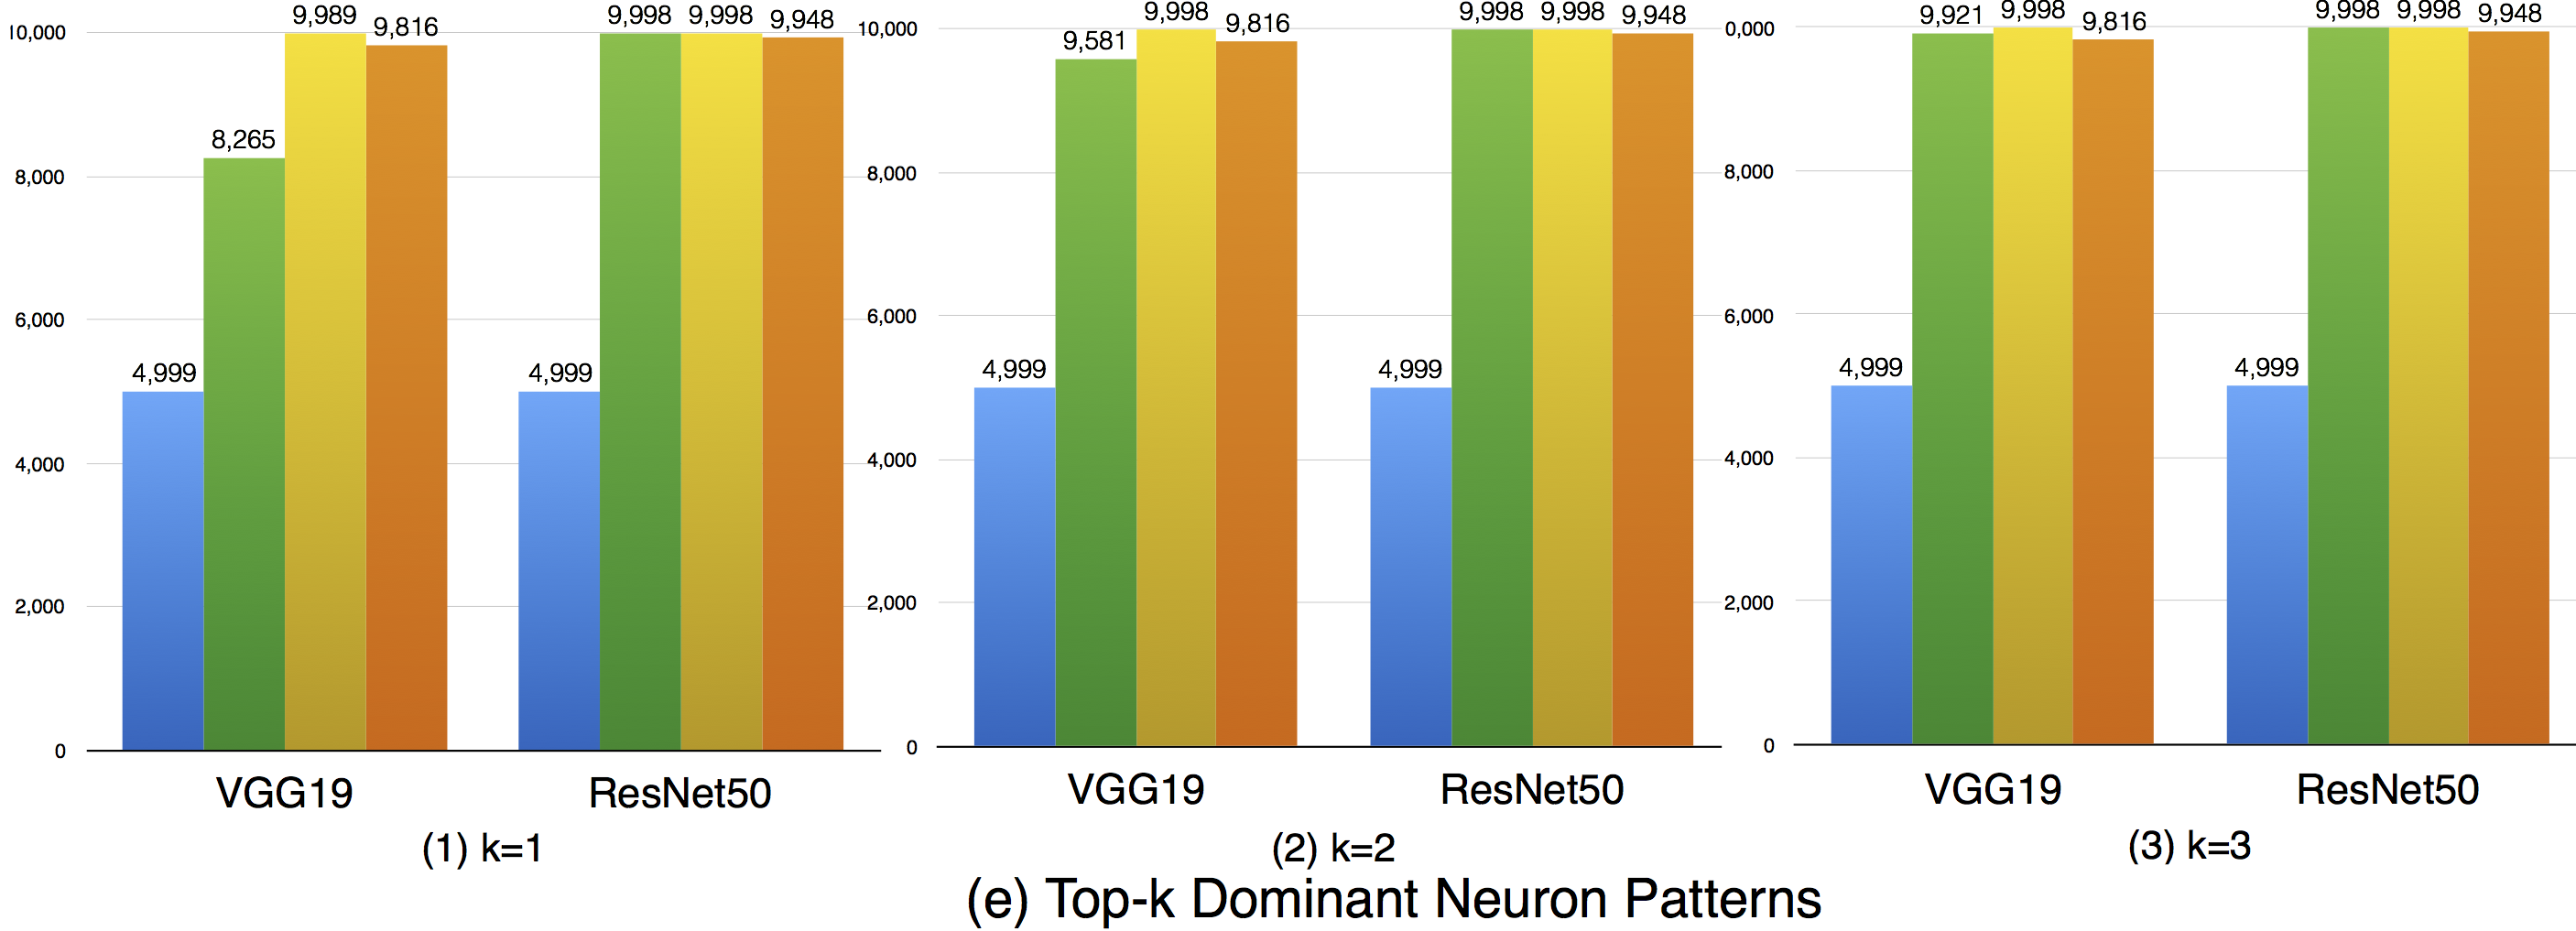
    Top-k dominant neuron coverage is a layer-level coverage criterion. For an input data, if a neuron' output is among the top k most activated neurons of a layer, it is defined as covered. In other words, this criterion measures whether a neuron has ever played a dominant role in its layer among all the test data. In our evaluation, we used three configurations (i.e., k=1,2,3) to evaluate the top-k dominant neuron coverage and observe the behavior under different cases.
    Overall, the adversarial test data does not improve this coverage criterion much compared with the original dataset. This means that the subset of most dominant neurons of each layer tends to be stable. As k increases, higher coverage is obtained, so a neuron of a layer may not ever paly as the most (top-1) dominant neuron, but it still may play as the second dominant or third dominant neurons of a layer. In the top-3 case, the overall coverages are relatively high, indicating that most neurons have played as one of the top-3 dominant neurons to support the function of DNNs.

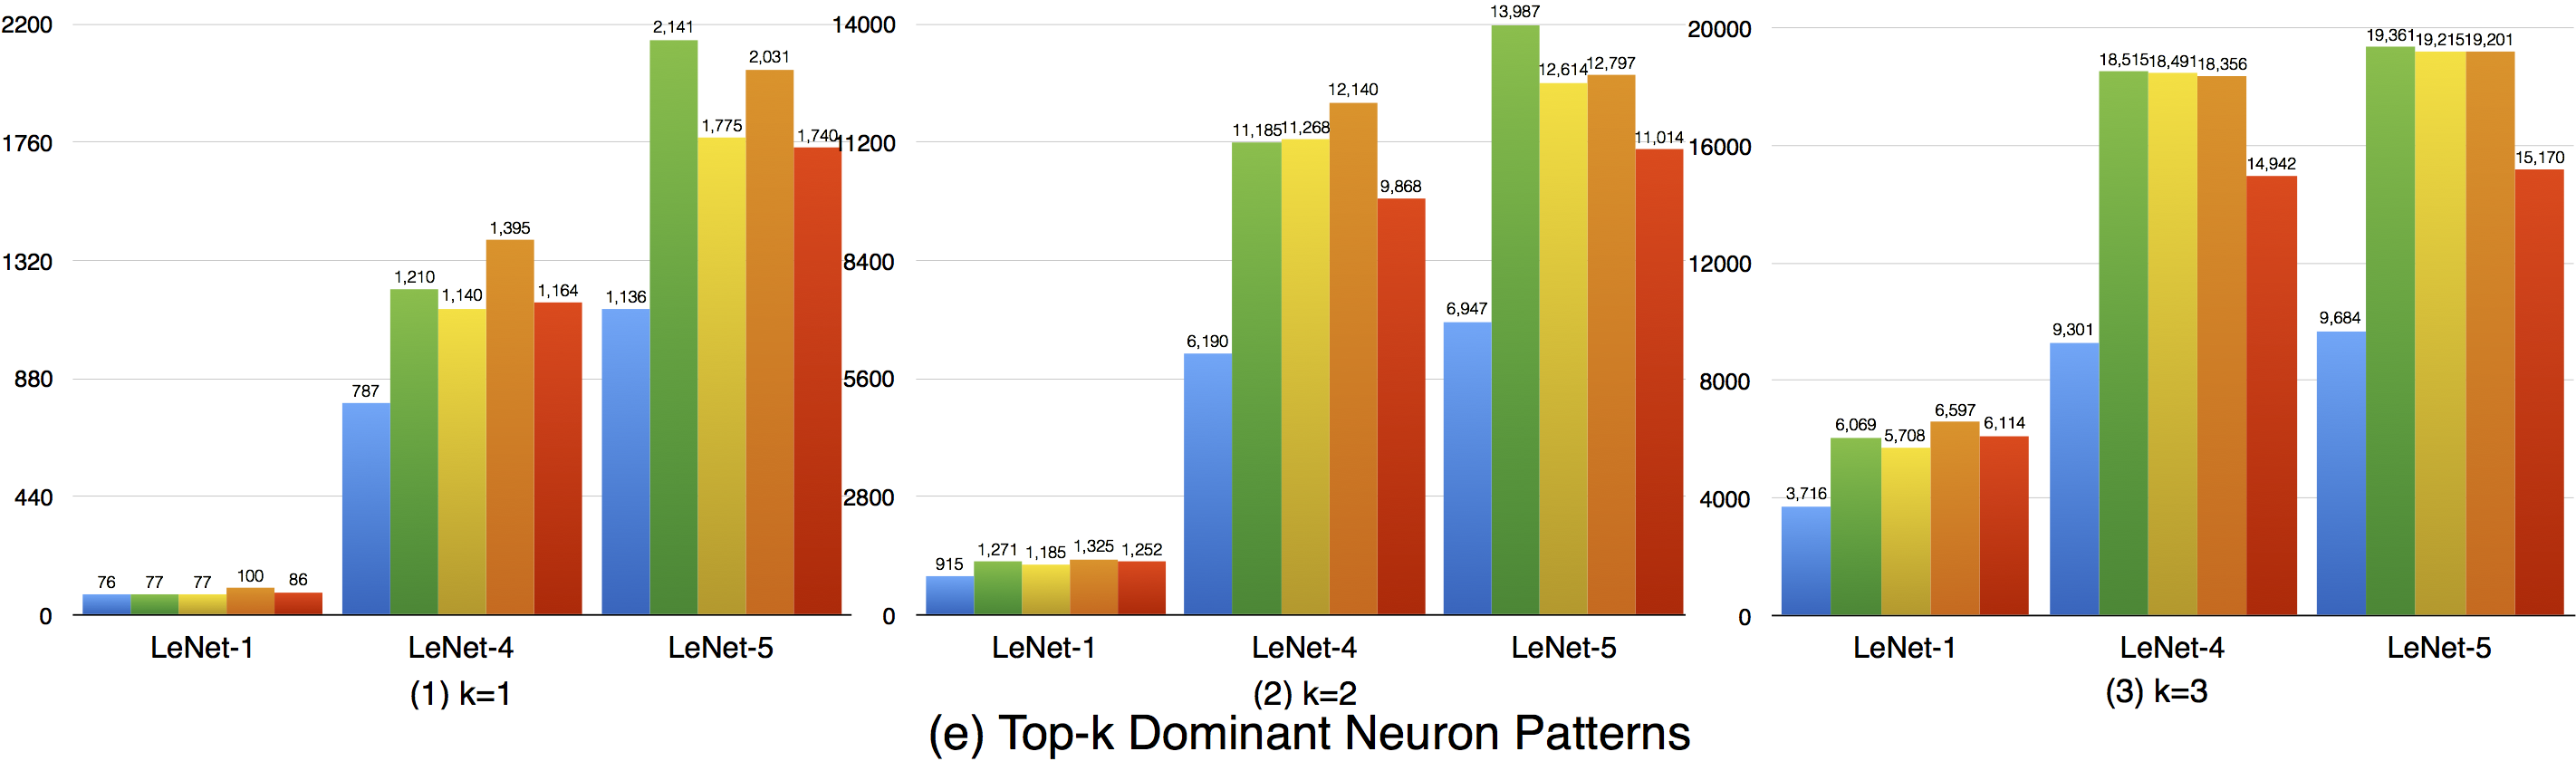
    Although the top-k dominant neuron subset of each layer is relatively stable, the top-k dominant neuron patterns are still able to distinguish different inputs in many cases. In particular, as k, DNNs neuron size and complexity grow, more different input data could be uniquely identified (see k=1 to 3). Furthermore, we could also see obvious dominant neuron pattern improvement for adversarial test data compared with original test data. This means that original test data and adversarial generated test data trigger quite different top-k dominant neuron patterns, and improving this criterion could increase the chance to detect DNN's defects.
    In summary, (1) top-k dominant neuron coverage describes the set of major dominant neurons of the DNN during its functioning; (2) although the top-k dominant neuron subset of each layer is relatively stable, their neuron patterns could mostly distinguish the input data; (3) adversarial test data follows different top-k dominant neuron patterns that trigger DNN defects compared with original test data that trigger the correct behavior of DNNs. Therefore, improving the top-k dominant neuron pattern would be an important indicator to increase the possibility for defect detection of DNNs.


    Part 2: DeepGauge's coverage critiera analysis results: ImageNet

    Compared with MNIST dataset and LeNet family DNNs, the ImageNet dataset and the DNNs (i.e., VGG19 and ResNet50) studied in this part are much larger in scale; In particular, VGG19 and ResNet50 contain 25 and 175 layers, with 16,168 and 94,056 neurons, respectively, which is more closed to the real-world application scenarios. We try to follow the same experimental configurations as in Part 1, using FGSM, BIM, JSMA and C@ for adversarial test data generation (we are not able to setup JSMA to run on ImageNet for VGG19 and ResNet50 in a reasonable time. The similar issue on JSMA was also reported in a previous work [Feature Squeezing: Detecting Adversarial Examples in DNNs], which might be caused by the large size of DNN's used for ImageNet). For the experiment on ImageNet, we have a total of 2(models) * 4(datasets) * (14 criteria settings) = 112 configurations.


    The experimental results for k-multisection neuron coverage are shown in Figure 2 (a). As the DNNs size and complexity grow, its main functional region is relatively more difficult to be covered by a test dataset, with a much lower coverage compared with Figure 1 (a) in Part 1 (for MINIST). Even though, compared with original test dataset, the adversarial test dataset still covers more unexplored functional regions where defects lie in. For example, on the VGG19, k=10,000 case, BIM (combined with original test data) improves the k-multisection neuron coverage by 41.5% (from 0.135 to 0.191). Again, it shows that improving k-mutisection neuron coverage critiera would potentially increase the chance for DNNs' defect detection.

    Compared with obtained K-mutisection neuron coverage, the strong neuron activation coverage is much lower for each corresponding setting. This is consistent with the results obtained in Part 1: (1) original test data more focuses on covering DNN's main functional region rather than strong neuron activation cases, (2) adversarial test data greatly improves the strong neuron activation coverage. For example, as the results shown for ResNet50 in Figure (b)(2), BIM improves the coverage by 293% (from 0.021 to 0.0825). (3) Since an adversarial input test data reveals a defect (misclassification or mis-prediction) of DNN, the results reveal that the defect would exist in (or trigger) the strong neuron activation regions, it is necessary to extensively test the strong neuron activation religions (improve this coverage) as well.

    In line with the strong neuron activation coverage obtained in Figure 2(b), Figure 2(c) gives the neuron boundary coverage. On each corresponding setting, neuron boundary coverage is even lower than strong neuron activation coverage, indicating that the lower boundary functional region might be even harder to be covered. For example, in Figure 2(c)(1), the boundary coverage obtained by original test dataset is only about 2.8% on VGG19 and 4.1% on ResNet50. As the boundary becomes tighter (from Figure 2 (c)(1) to (3)), the coverage decreases, which shows that a tighter boundary might be even more difficult to cover. Even though, the defects could still exist in such regions as shown by the adversarial test data results. Therefore, obtaining a higher boundary neuron boundary coverage would be another important coverage critiera for DNN defect detection.

    For top-k dominant neuron coverage (Figure 2(d)) and top-k dominant neuron patterns (Figure 2(e)), we find that although the DNNs we studied (VGG19 and ResNet50) in this part are much larger than LeNet family DNNs in part 1, the top-dominant neuron coverage is still relatively stable for original test dataset and the combined dataset generated by adversarial technique, indicating that the subset of top-k most active neurons of each layer in a DNN do not change much on original data and adversarial generated test data. The combined patterns from these top-k dominant neurons of each layer, however, could mostly distinguish different input test data, even for k=1 case. This means an adversarial test data may often follow a different top-k dominant neuron pattern from original test data; the more top-k dominant neuron patterns could be obtained by an input dataset, the more probable that the DNN defects could be detected.


    Part 3: Deepexplore's neuron activation coverage results

    DeepExplore proposes a kind of neuron activation coverage (DNC) to measure the robustness of a DNN. A key parameter of DNC is a user-specified threshold, in which if an output of a neuron is larger than the threshold, the neuron is counted as covered. To demonstrate the difference of our set of criteria with DNC, we set up the DNC evaluation with the same dataset, model, as well as adversarial data generation settings as described in Part 1 and Part 2. For the threshold parameter, we set the thresholds 0 and 0.75, used in the DeepExplore's paper; to make even more comprehensive comparisons, we also use two another settings 0.2, and 0.5. The following two figures are the results obtained for MNIST and ImageNet, respectively.
    The results show that (1) Different threshold settings could potentially result in quite different DNC; for a specific DNN, DNC obtained on it is largely determined by the selected threshed. When threshold=0, the DNC is almost 100% for all cases. As the threshold increases, the DNC decreases, (2) On a fixed threshold (e.g., 0.5), DNCs obtained for original test dataset and the combined adversarial test dataset are almost the same, showing that DNC is unable to differentiate the original test data (that triggers the correct behavior of a DNN) from adversarial examples (that triggers the incorrect behavior of a DNN).

    Compared with DNC, our DeepGauge's testing criteria give an more in-depth and accurate feedback on testing DNNs. From the neuron level, we propose k-multisection neuron coverage to measure how a test dataset covers the main functional region of the neurons of a DNN. We further propose strong neuron activation coverage and boundary neuron coverage to measure whether the corner-case regions for neurons of a DNN are covered. Moreover, from the layer (higher) level, we propose the top-k dominant neuron coverage and top-k dominant neuron patterns, which identifies major functional component (set of dominant neurons) for each layer of a DNN as well as how the dominant neuron pattern is related to the DNN defects detection. Our in-depth evaluation demonstrates the usefulness of DeepGauge's testing criteria, showing that it could accurately capture the original test dataset and the adversarial data generated by the well-known adversarial techniques, which lays down the foundation towards understanding and constructing robust deep learning system with high quality.

    MNIST

    ImageNet